×

注意!页面内容来自https://www.mdpi.com/2079-7737/11/6/870,本站不储存任何内容,为了更好的阅读体验进行在线解析,若有广告出现,请及时反馈。若您觉得侵犯了您的利益,请通知我们进行删除,然后访问 原网页

Next Article in Journal
Isolation of Listeria ivanovii from Bulk-Tank Milk of Sheep and Goat Farms—From Clinical Work to Bioinformatics Studies: PrevalenceAssociation with Milk QualityAntibiotic SusceptibilityPredictorsWhole Genome Sequence and Phylogenetic Relationships
Next Article in Special Issue
Marine Autotroph-Herbivore Synergies: Unravelling the Roles of Macroalgae in Marine Ecosystem Dynamics
Previous Article in Journal
Molecular Identification and Characterization of Two Groups of Phytoplasma and Candidatus Liberibacter Asiaticus in Single or Mixed Infection of Citrus maxima on Hainan Island of China
Previous Article in Special Issue
Effects of Trace Metals and Municipal Wastewater on the EphemeropteraPlecopteraand Trichoptera of a Stream Community
 
 
< type="text/css"> img.review-status { width: 30px; }
Article

Plant Diversity and Fungal Richness Regulate the Changes in Soil Multifunctionality in a Semi-Arid Grassland

1
Key Laboratory of Vegetation EcologyInstitute of Grassland ScienceNortheast Normal UniversityMinistry of EducationChangchun 130024China
2
Jilin Songnen Grassland Ecosystem National Observation and Research StationChangchun 130024China
*
Author to whom correspondence should be addressed.
Submission received: 7 May 2022 / Revised: 3 June 2022 / Accepted: 3 June 2022 / Published: 6 June 2022

Abstract

:

Simple Summary

Understanding relationships between biodiversity and ecosystem functions is important in the context of global plant diversity loss. We evaluated the relationships between soil bacterial and fungal diversityrare microbial taxaand soil multifunctionality in a semi-arid grassland with varied plant diversity levels. The fungal richness rather than bacterial richness was positively related to soil multifunctionality. The relative abundance of saprotrophs was positively correlated with soil multifunctionalityand the relative abundance of pathogens was negatively correlated with soil multifunctionality. Furthermorethe rare fungal taxa played a disproportionate role in regulating soil multifunctionality. The shift of plant biomass allocation patterns increased plant below-ground biomass in the high diversity plant assemblageswhich can alleviate soil microbial carbon limitations and enhance the fungal richnessthus promoting soil multifunctionality. This study provides a new perspective for evaluating the relative roles of fungal and bacterial diversity in maintaining multiple soil functions under global plant diversity loss scenarios.

Abstract

Loss in plant diversity is expected to impact biodiversity and ecosystem functioning (BEF) in terrestrial ecosystems. Soil microbes play essential roles in regulating ecosystem functions. Howeverthe important roles and differences in bacterial and fungal diversity and rare microbial taxa in driving soil multifunctionality based on plant diversity remain poorly understood in grassland ecosystems. Herewe carried out an experiment in six study sites with varied plant diversity levels to evaluate the relationships between soil bacterial and fungal diversityrare taxaand soil multifunctionality in a semi-arid grassland. We used Illumina HiSeq sequencing to determine soil bacterial and fungal diversity and evaluated soil functions associated with the nutrient cycle. We found that high diversity plant assemblages had a higher ratio of below-ground biomass to above-ground biomasssoil multifunctionalityand lower microbial carbon limitation than those with low diversity. Moreoverthe fungal richness was negatively and significantly associated with microbial carbon limitations. The fungal richness was positively related to soil multifunctionalitybut the bacterial richness was not. We also found that the relative abundance of saprotrophs was positively correlated with soil multifunctionalityand the relative abundance of pathogens was negatively correlated with soil multifunctionality. In additionthe rare fungal taxa played a disproportionate role in regulating soil multifunctionality. Structural equation modeling showed that the shift of plant biomass allocation patterns increased plant below-ground biomass in the highly diverse plant plotswhich can alleviate soil microbial carbon limitations and enhance the fungal richnessthus promoting soil multifunctionality. Overallthese findings expand our comprehensive understanding of the critical role of soil fungal diversity and rare taxa in regulating soil multifunctionality under global plant diversity loss scenarios.

1. Introduction

Soil supports a wide range of ecological functions and services that are important to human welfareand soil multifunctionality can be used as a comprehensive index to evaluate soil quality [1,2,3,4]. Multifunctionality is an essential biological and management concept that describes the ability of an ecosystem to maintain multiple ecological functions simultaneously [1,2,5]. As significant drivers of ecosystem functionssoil microbial communities can be regulated by plant diversity via changing the nutrient availability and microenvironmental conditions [6,7,8]. Howeverglobal climate changes and intensive anthropogenic activities have led to the loss of plant diversity in grassland ecosystems [2,9,10,11]. Thereforethere remains an urgent need to understand the mechanisms by which soil microorganisms drive soil multifunctionality in the context of global plant diversity loss.
Below-ground microbes comprise a large portion of global terrestrial ecosystem life’s genetic diversity and support important ecosystem functions and servicessuch as biomass productionnutrient cyclingand decomposition of organic matter [10,12,13]. Additionalitysoil microorganisms are an essential link between the above-ground and below-ground components of terrestrial ecosystems [14,15,16,17]. Bacteria and fungi constitute vital parts of the soil microbiome [18]. Neverthelessbacteria and fungi play different roles in regulating ecosystem processes [14]. In detailbacteria are the essential drivers of soil N cycle processessuch as N2 fixationnitrificationand denitrification [19,20,21]. Howeverother studies have suggested that soil fungal communities might dominate in driving soil functions [14]. Soil fungi can decompose recalcitrant plant litter efficiently and form links with roots to capture and transport subsurface carbon (C) [22]. For instancesaprophytic fungi are primary mediators for the decomposition of plant litterand their mycelium networks across the soil litter interface and networks are a highly dynamic channel through which nutrients can be easily distributed [23]. Despite the above studiesmost research has concentrated on how soil microbes affect individual or specific nutrient cycling functions. Howeverfew studies have evaluated the relative significance of bacterial and fungal diversity in regulating soil multifunctionality in the context of plant diversity in a semi-arid grassland.
Furthermorethe effects of rare microbial taxa on soil functions have often been ignored in most previous soil multiple functions studies because they have mainly concentrated on predominant taxa; a majority of rare microbial taxa were frequently eliminated from original datasets. Howeverrare microbial taxa have important ecological roles because these may be activated to perform critical functions under environmental changes [24,25]. For instancerare taxa were found to play essential roles in nutrient cycling after disturbances in aquatic ecosystems [26]. Rare microbial taxa have also been used as indicators of changes in ecosystem functions under long-term greenhouse cultivation conditions in subtropical agricultural soils [27]. Thereforerare microbial taxa can represent a microbial “seed bank” that may be activated when the environment is disturbed [24,28]. The intensity and frequency of plant diversity loss due to global climate change are expected to increase in the future [9,29,30]; thereforeit is of great significance to link the ecological functions of rare microbial taxa with soil multifunctionality. Unfortunatelyrelevant knowledge is still scarceespecially in semi-arid grassland ecosystems. Such knowledge is critical for developing a management framework to maintain rare taxa involved in functionality and decrease the impact of future climate change on a semi-arid grassland.
Loss in plant diversity of terrestrial ecosystems might aggravate C and other nutrient limitations [30,31,32]. Heterotrophic organisms depend on plants to obtain C substrates; thereforethere is ample evidence that soil microbes are usually limited by C [33]. Microorganisms play an essential role in ecosystem functions [6,18,34]; thusmore research is undoubtedly required to evaluate how the shift in microbial nutrient limitations affects microbes under changes in plant diversity. Soil enzymes produced by microbes transform substrates in soil C and nutrient cycles [35]. Thusenzymatic stoichiometry provides a method for this study [35]. Several studies have shown that less diverse plant communities allocate fewer photosynthates to below-ground ecosystems by decreasing the exudation of root exudates [32]. Root exudates are an important C source for microbial growth [36]; thereforea less diverse plant community might intensify microbial C limitation [37]. C limitation could affect microbial biosynthesis processes [35]; thuslower below-ground biomass allocation would reduce soil functions such as microbial growth and respiration by increasing microbial C limitation [36,38]. The above results show that plant diversity affects soil microbial communities by trophic interactions and altering soil biochemical processes [12,13]. Thusthe loss of plant diversity may alter the relationships between plant and soil microbial communities. Considering that soil microbial communities mediate ecosystem functionsit is essential to elucidate the mechanisms by which plant-diversity-induced changes in microbial C limitation regulate soil multifunctionality through impacting soil microorganisms in a meadow grassland.
In additionecosystem multifunctionality is different from ecosystem services multifunctionality in that the former represents the overall performance of an ecosystem without considering stakeholders; whereas the latter is defined as the ability of ecosystems to synergistically provide various ecosystem functions and services that translate into a variety of social benefits and welfare [1]. Thereforeinvestigations of ecosystem service multifunctionality have significant importance in future semi-arid grassland ecosystems management and sustainable development. In this studya meadow grassland in northeast China was selected to discuss the soil multifunctionality and microbial driving mechanisms under a plant diversity loss scenario. The objectives of this study were to 1) evaluate the important roles of soil bacterial and fungal diversity and rare taxa in driving soil multifunctionality under different plant diversity conditions; 2) reveal the underlying mechanisms by which plant-diversity-induced alterations of microbial C limitation regulate soil multifunctionality through soil microorganisms; 3) provides a scientific reference for the evaluation of semi-arid grassland ecosystem services multifunctionality.

2. Materials and Methods
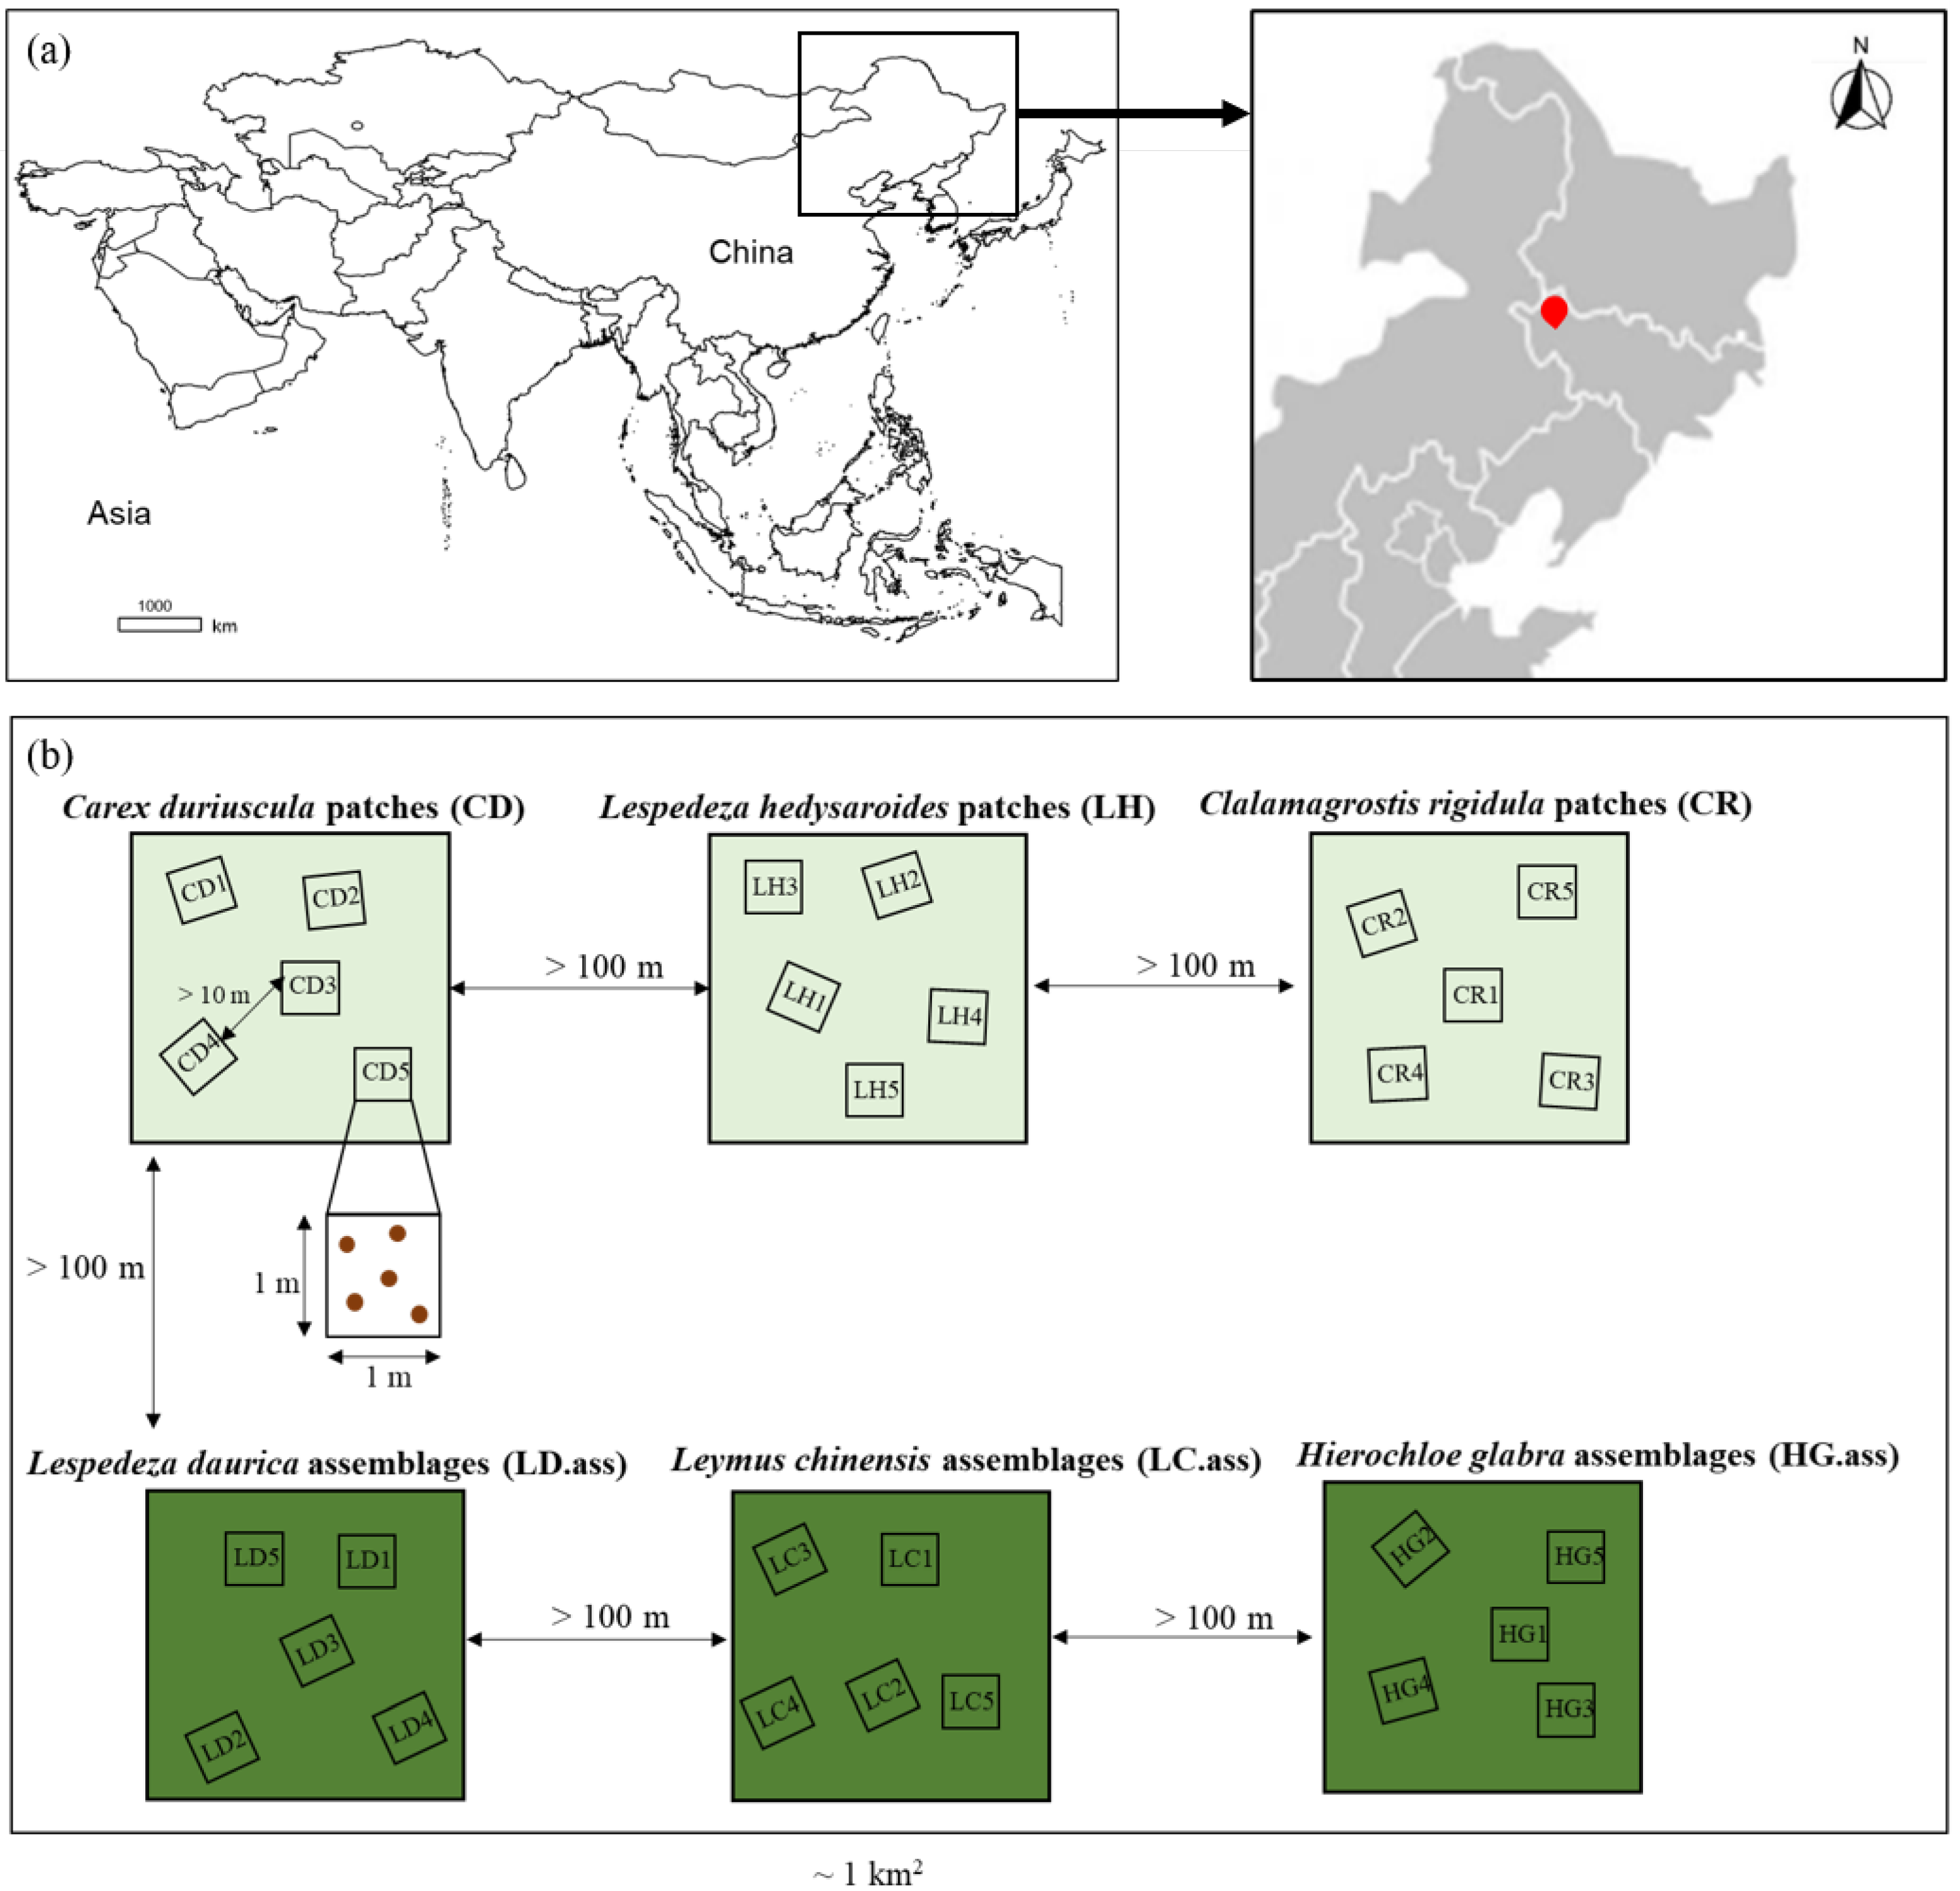
2.1. Study Site

The experiment was conducted at the Tongyu Observatory in a semi-arid climate and environment (44° 25′ N122° 52′ E). This site is located within the Songnen grassland ecosystem of northeastern China (Figure 1a). The vegetation is a meadow steppesituated at the eastern end of the Eurasian grassland belt with Leymus chinensis (Trin.) Tzvelev (https://www.ipni.org/) (accessed on 1 June 2022) is the dominant species. The soil texture is clay loamaccording to the International Society of Soil Science Standard. The study area has a temperate continental monsoon climate. The mean annual precipitation is ~404 mmand more than 80% of the rainfall is concentrated during the growing season (from May to September). The mean annual temperature is approximately 5.7 °C.

2.2. Experimental Design and Sampling

Within approximately 1 km2 of the study areawe randomly selected three single plant species patches i.e.Carex duriuscula C.A.Mey.Lespedeza hedysaroides (Pall.) Kitag.and Calamagrostis rigidula A.I.Baranov and Skvortsov assemblages and three multiple species coexisting plant assemblages with different dominant Lespedeza daurica (Laxm.) Schindl.L. chinensisand Hierochloe glabra Trin. naturally existing in the grassland. Single species assemblages and multiple species assemblages represent low and high diversity levelsrespectively. The plant species composition is shown in Table S1. A vegetation survey was conducted in mid-August 2018 when the standing biomass reached its maximum. For the six study sites selected abovethe interval between every two sites was greater than 100 m. For plant and soil samplingfive plots (1 m × 1 m) with an interval of more than 10 m were randomly selected at each study site (Figure 1b). In this studysoil characteristics of low diversity plant assemblages and high diversity plant assemblages were similar (p > 0.05) (Figure S1); thussoils were comparable across different plant diversity plots. We selected six sites with similar soil characteristics but different levels of plant diversity. It is reasonable to obtain data based on one-time sampling to explore the impact of different levels of plant diversity on soilmicroorganismsand soil functions. Additionallythis method has been widely adopted by many studies in the field of ecology [32,39].
All the plant species were identified and recorded in each plot; thensoil and plant samples were collected simultaneously from each plot. Five soil cores (0–10 cm) were randomly selected in each plot by a soil auger (5 cm diameter)then mixed to form a composite sample. Nextthe soil samples were sieved (2 mm) to remove any roots and stones. We harvested above-ground living plants to evaluate each plot’s above-ground biomass (AGB). The below-ground biomass (BGB) of each plot was measured by root biomass from three soil cores with a diameter of 10 cm and a depth of 30 cm. All the soil samples were placed in well-sealed zippered bags and transported to the laboratory within 24 h in cooling boxes.

2.3. Plant and Soil Samples Analysis

The plant AGB and BGB were determined by plant materials heated at 105 °C for 30 min to rapidly cease metabolic activities [40] and then oven-dried at 65 °C for 48 h until the weight remained constant [41]. The soil samples were divided into three subsamples for physiochemical analyses and the assessment of microbial communities. One aliquot of soil was stored at 4 °C and used to determine the soil water content (SWC)soil available N (AN) content (NH4+-N and NO3-N)soil net nitrification rate (Nn)and the net N mineralization rate (Nm). Another aliquot of soil was stored at −80 °C and used for the analysis of high-throughput sequencing and to assess activities of α-1,4-glucosidase (αG)β-1,4-glucosidase (βG)β-1,4-xylosidase (βX)β-D-cellobiohydrolase (CBH)leucine aminopeptidase (LAP)β-1,4-N-acetylglucosaminidase (NAG)and alkaline phosphatase (ALP). Finallythe third aliquot of soil was air-dried at room temperature for soil pHelectrical conductivity (EC)soil total organic carbon (TOC)total soil nitrogen (TN)total soil phosphorus (TP)and available soil phosphorus (AP) analyses.
The soil pH was detected in deionized water (soil: water = 1:5w:v) with a portable pH meter (Leichi PHBJ-260ShanghaiChina)and the soil EC was measured with an electronic conductivity meter (Leici DDS307ShanghaiChina) [42]. The SWC was measured as the weight loss recorded after the fresh soils had been oven-dried to a constant weight at 105 °C [10]. The soil TN content was measured with an elemental analyzer (vario EL cubeElementarLangenselboldGermany). Briefly30 mg of the air-dried soil was put into a tinfoil cup and tightly wrapped in soil and then put into an automatic sampling tray; the results were analyzed on the machine. Soil TOC was determined with an elemental analyzer (Isoprime 100Isoprime Ltd.ManchesterUK). The NH4+-N and NO3-N concentrations were measured by extraction with 2 M KCl (soil: water = 1: 5w:v) and analyzed with a continuous flow analyzer (FuturaAlliance-AMS) [41]. The Nn and Nm were calculated according to alterations in the concentrations of NH4+-N and NO3-N before and after incubation [43]. For soil TP0.5 g air-dried soil and ball milling were digested with HClO4 (7.7 mL75%) at 203 °C for 75 min [44]. Soil AP was extracted with 0.5 M NaHCO3and the molybdenum blue colorimetric method was used to analyze [45]. All enzyme activities were measured using a 4-methylumbelliferyl (MUB) substrateexcept for 7-amino-4-methyl-coumarin (7-AMC) for the LAP [46]. Seven enzyme activities were determined in black 96-well microplates. Four replicate wells were set up for each enzyme test sample (200 μL slurry + 50 μL substrate) and corresponding substrate control (200 μL buffer + 50 μL substrate). Four replicate wells were set up for standard fluorescence (200 μL buffer + 50 μL standard)slurry control (200 μL slurry + 50 μL buffer)and quench standards (200 μL slurry + 50 μL standard). The assay plate was incubated in a dark environment at 25 °C for 3 h. Fluorescence was measured using a microplate fluorometer (TECAN infinite F200Tecan GroupSwitzerland) with excitation and emission filters of 360 nm and 460 nmrespectively.

2.4. Assessment of Microbial Communities

According to the manufacturer’s protocoltotal genomic DNA was extracted from 0.3 g of soil with the PowerSoil DNA Isolation Kit (MO BIO LaboratoriesInc.CarlsbadCAUSA). The concentration and purity of the extracted DNA were measured with a NanoDrop 2000 spectrophotometer (Thermo Fisher ScientificWalthamMAUSA ). DNA quality was evaluated by 1% agarose gel electrophoresis. We acquired information on the diversity and composition of soil bacteria and fungi by performing 16S rRNA and ITS genes amplicon sequencing and the 338F/806R (5′-ACTCCTACGGGAGGCAGCA-3′5′-GGACTACHVGGGTWTCTAAT-3′) and ITS1F/ITS2R (5′-CTTGGTCATTTAGAGGAAGTAA-3′5′-GCTGCGTTCTTCATCGATGC-3′) primer pairsrespectively. The total volume of the PCR amplification for bacteria and fungi was 50 μLincluding 10 μL buffer0.2 μL Q5 High-Fidelity DNA Polymerase10 μL High GC Enhancer1 μL dNTPa 10 μM concentration of each primerand 60 ng genome DNA. The thermal cycling conditions were 95 °C denaturation for 5 min15 cycles at 95 °C for 1 min50 °C for 1 min72 °C for 1 minand 72 °C final extension for 7 min. Ultimatelywe quantified all PCR products by Quant-iT™ dsDNA HS Reagent and pooled them together. Furthermorewe conducted a high-throughput sequencing analysis of 16S rRNA and ITS genes by the Illumina Hiseq 2500 platform (2 × 250 paired ends) at Biomarker Technologies Corporation (BeijingChina). Bacterial and fungal sequences were quality-filtered with the QIIME software package and merged using the FLASH software package [47]. The operational taxonomic units (OTUs) were defined by 97% similarity. Representative sequences of bacteria and fungi were annotated with the SILVA and UNITE databases [48]. The final total data set retained 1852 and 1325 OTU numbers and 2,057,790 and 2,071,174 clean reads for bacteria and fungirespectively. The raw bacterial and fungal reads were deposited into the National Center for Biotechnology Information (NCBI) Sequence Read Archive (SRA) database under accession numbers PRJNA810930 and PRJNA810946respectively.

2.5. Definition of Abundant and Rare Taxa

Previous studies have widely used relative abundance as a metric to describe microbial taxa or OTUs in their environment. Thusrelative abundance is useful for classifying abundant or rare taxa in microbial communities [24,49]. We identified relative abundance thresholds as 1% for abundant taxa and 0.01% for rare taxa [26,27,50]. These classifications ignored intermediate taxa (relative abundance between 0.01 and 1%) and oscillatory taxa (rare and abundant under different environment conditions) [27]. All OTUs were classified into six categories based on the criteria used in recent studies [26,27,50]: always abundant taxa (AATrelative abundance ≥ 1%); conditionally abundant taxa (CATrelative abundance ≥ 0.01% in all samples and ≥ 1% in some samples); always rare taxa (ARTrelative abundance < 0.01% in all samples); conditionally rare taxa (CRTrelative abundance < 0.01% in some samples but never >1% in any samples); moderate taxa (MTrelative abundance between 0.01% and 1% in all samples); and conditionally rare and abundant taxa (CRATrelative abundance < 0.01% in some samples and ≥ 1% in some samples). FinallyAAT and CAT were classified as abundant taxaand ART and CRT were classified as rare taxa [26,27,50].

2.6. Assessment of Multifunctionality

Soil multifunctionality was quantified based on ten soil functions widely adopted in previous studies [51,52,53,54,55]. These parameters are related to organic matter decompositionclimate regulationand nutrient cyclingincluding αGβGβXCBHLAPNAGNnNmALPand AP. Of themαGβGβXand CBH represent the C cycleLAPNAGNnand Nm represent the N cycleand ALP and AP represent the P cycle (Table S2). The averaging and threshold approaches have commonly been used to estimate the relationship between biodiversity and multifunctionality [2,34,53,56,57,58]. In this studywe evaluated the soil multifunctionality index using three methodswhich contained averaging approach [56]single-thresholdand multiple-threshold approach [57,58]. To obtain an average soil multifunctionality indexeach function was standardized by Z-score transformation and then averaged [2,56]. We used a single-threshold approach to calculate the number of soil functions exceeding a given threshold (25%50%75%and 90%) [2,54]. Howeverthe multiple-threshold method can demonstrate the effect of bacterial and fungal richness on soil multifunctionality in the full threshold range.

2.7. Enzymatic Stoichiometry

We constructed the vector analysis of soil enzymatic stoichiometry to evaluate soil microbial C limitation levels [59]. A longer vector length represents a stronger C limitation.
Vector   length   ( unitless ) = ( ln β G / ln ( NAG + LAP ) ) 2 + ( ln β G / lnALP ) 2

2.8. Statistical Analysis

We used an independent sample t-test to evaluate the differences in plant and soil properties and soil multifunctionality between different levels of plant diversity. When the data did not meet the requirements for normality (Shapiro Wilk test) and homogeneity of variance (Bartlett test)log transformations were performed on the data. We calculated the microbial richness with the “vegan” package [60]. Ordinary least squares (OLS) linear regression was conducted to explore the relationships between microbial C limitation and microbial richness; OLS linear regression also was conducted to explore the relationships between bacterial richnessfungal richnessrelative pathogen abundancesaprotrophic relative abundancerelative symbiont abundanceand soil multifunctionality [14,15,34,61]. Three methods of soil multifunctionality were evaluated with the “multifunc” package [58]. According to recent studies [14,47,61,62]functions were obtained based on fungal taxa by the FUNGuild database (http://www.stbates.org/guilds/app.php) (accessed on 6 January 2019). Random forest modeling analysis was applied with the “randomForest” package [63] to identify the major statistically significant microbial taxa (OTU level) in impacting soil multifunctionality. Thenseven microbial taxaincluding four bacterial taxa and three fungal taxawere selected in the random forest modeling. The “A3” package [64] was used to assess the importance of each predictor on soil multifunctionality. In additionwe used piecewise structural equation modeling (SEM) with the “piecewiseSEM” [65]“nlme” and “lme4” packages [66] to investigate the potential direct and indirect effects of plant diversity on soil multifunctionality. The prior model was constructed based on current ecological knowledge of the grassland ecosystems [7,36,53,67] to evaluate the link between soil biodiversity and multifunctionality (averaging)assuming that plant diversity altered plant biomass allocation patterns and microbial C limitationthus promoting soil microbial richness and soil multifunctionality (Figure S2a). Fisher’s C test (0 ≤ Fisher’s C ≤ 2 df and 0.05 < p ≤ 1.00) was used to verify the rationality of the modeling results. Among significant modelsthe one with the lowest Akaike information criterion (AIC) value was selected for the final SEM analysis [68] (Figure S2b–d). All statistical analyses and visualizations of this study were performed in R v.4.1.2 software.

3. Results

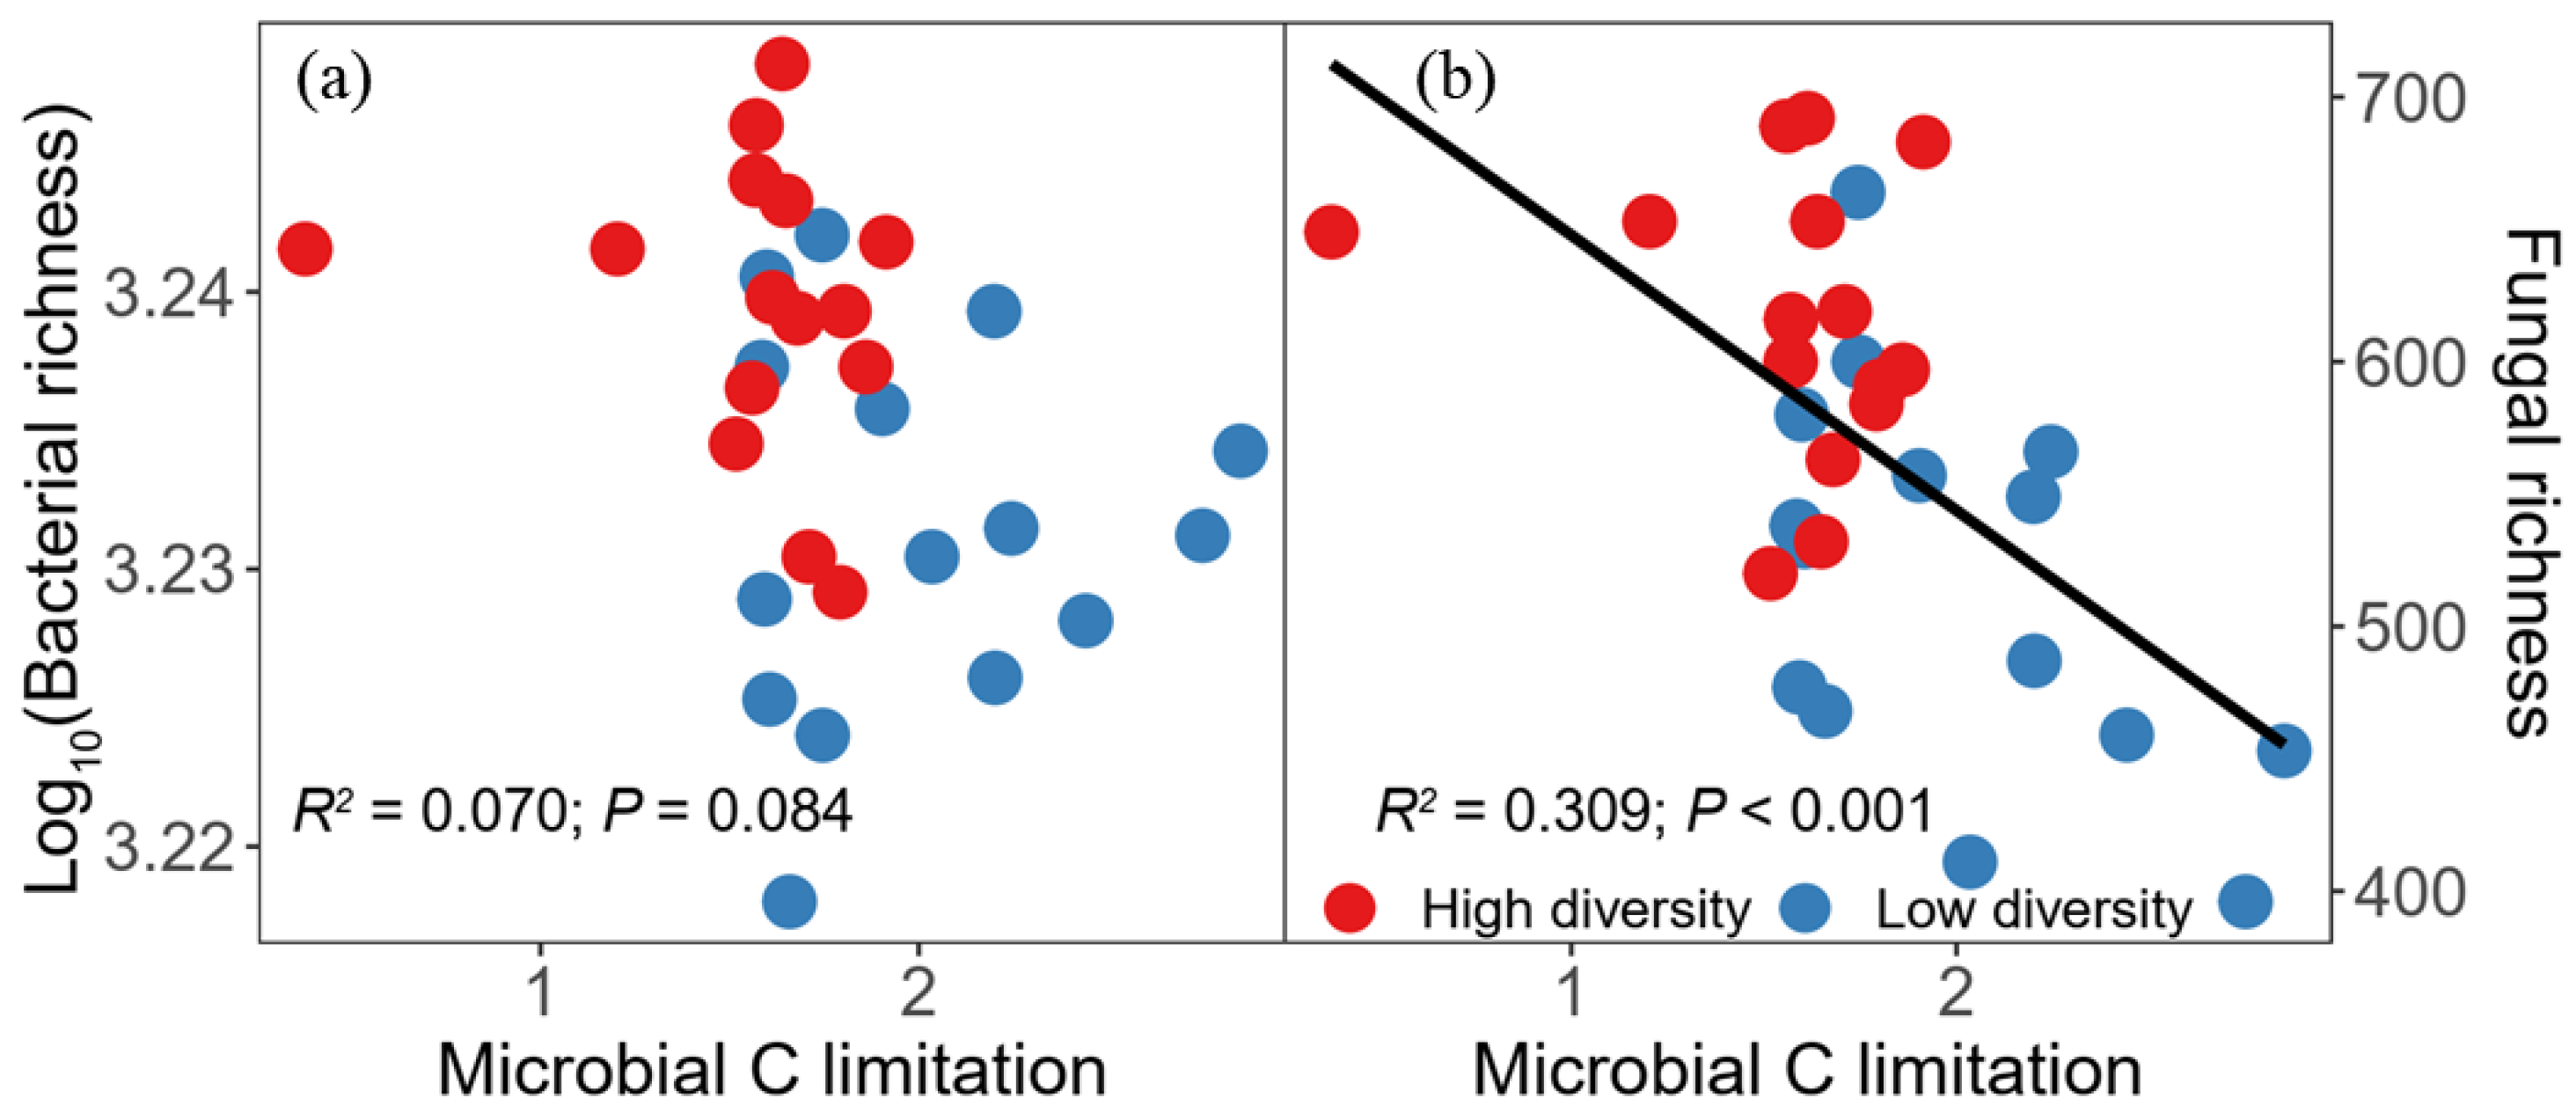
3.1. Plant and Soil Properties and Soil Multifunctionality

The ratio of BGB to AGB was significantly higher with high plant diversity than with low plant diversity (Figure 2a; p < 0.001). Microbial C limitation was higher with low diversity than with high diversity (Figure 2b; p < 0.01). The results showed that plant diversity significantly altered soil multifunctionality (Figure 2c)i.e.high diversity significantly increased soil multifunctionality compared with low plant diversity (Figure 2c; p < 0.001). SWCsoil pHECANand TOC showed no significant differences between the two plant diversities (Figure S3a–d,g). Soil TN and TP were higher with low diversity than with high diversity (Figure S3e,f; p < 0.05 and p < 0.01). In additionthe soil C/N was much higher with high diversity than with low diversity (Figure S3h; p < 0.001).

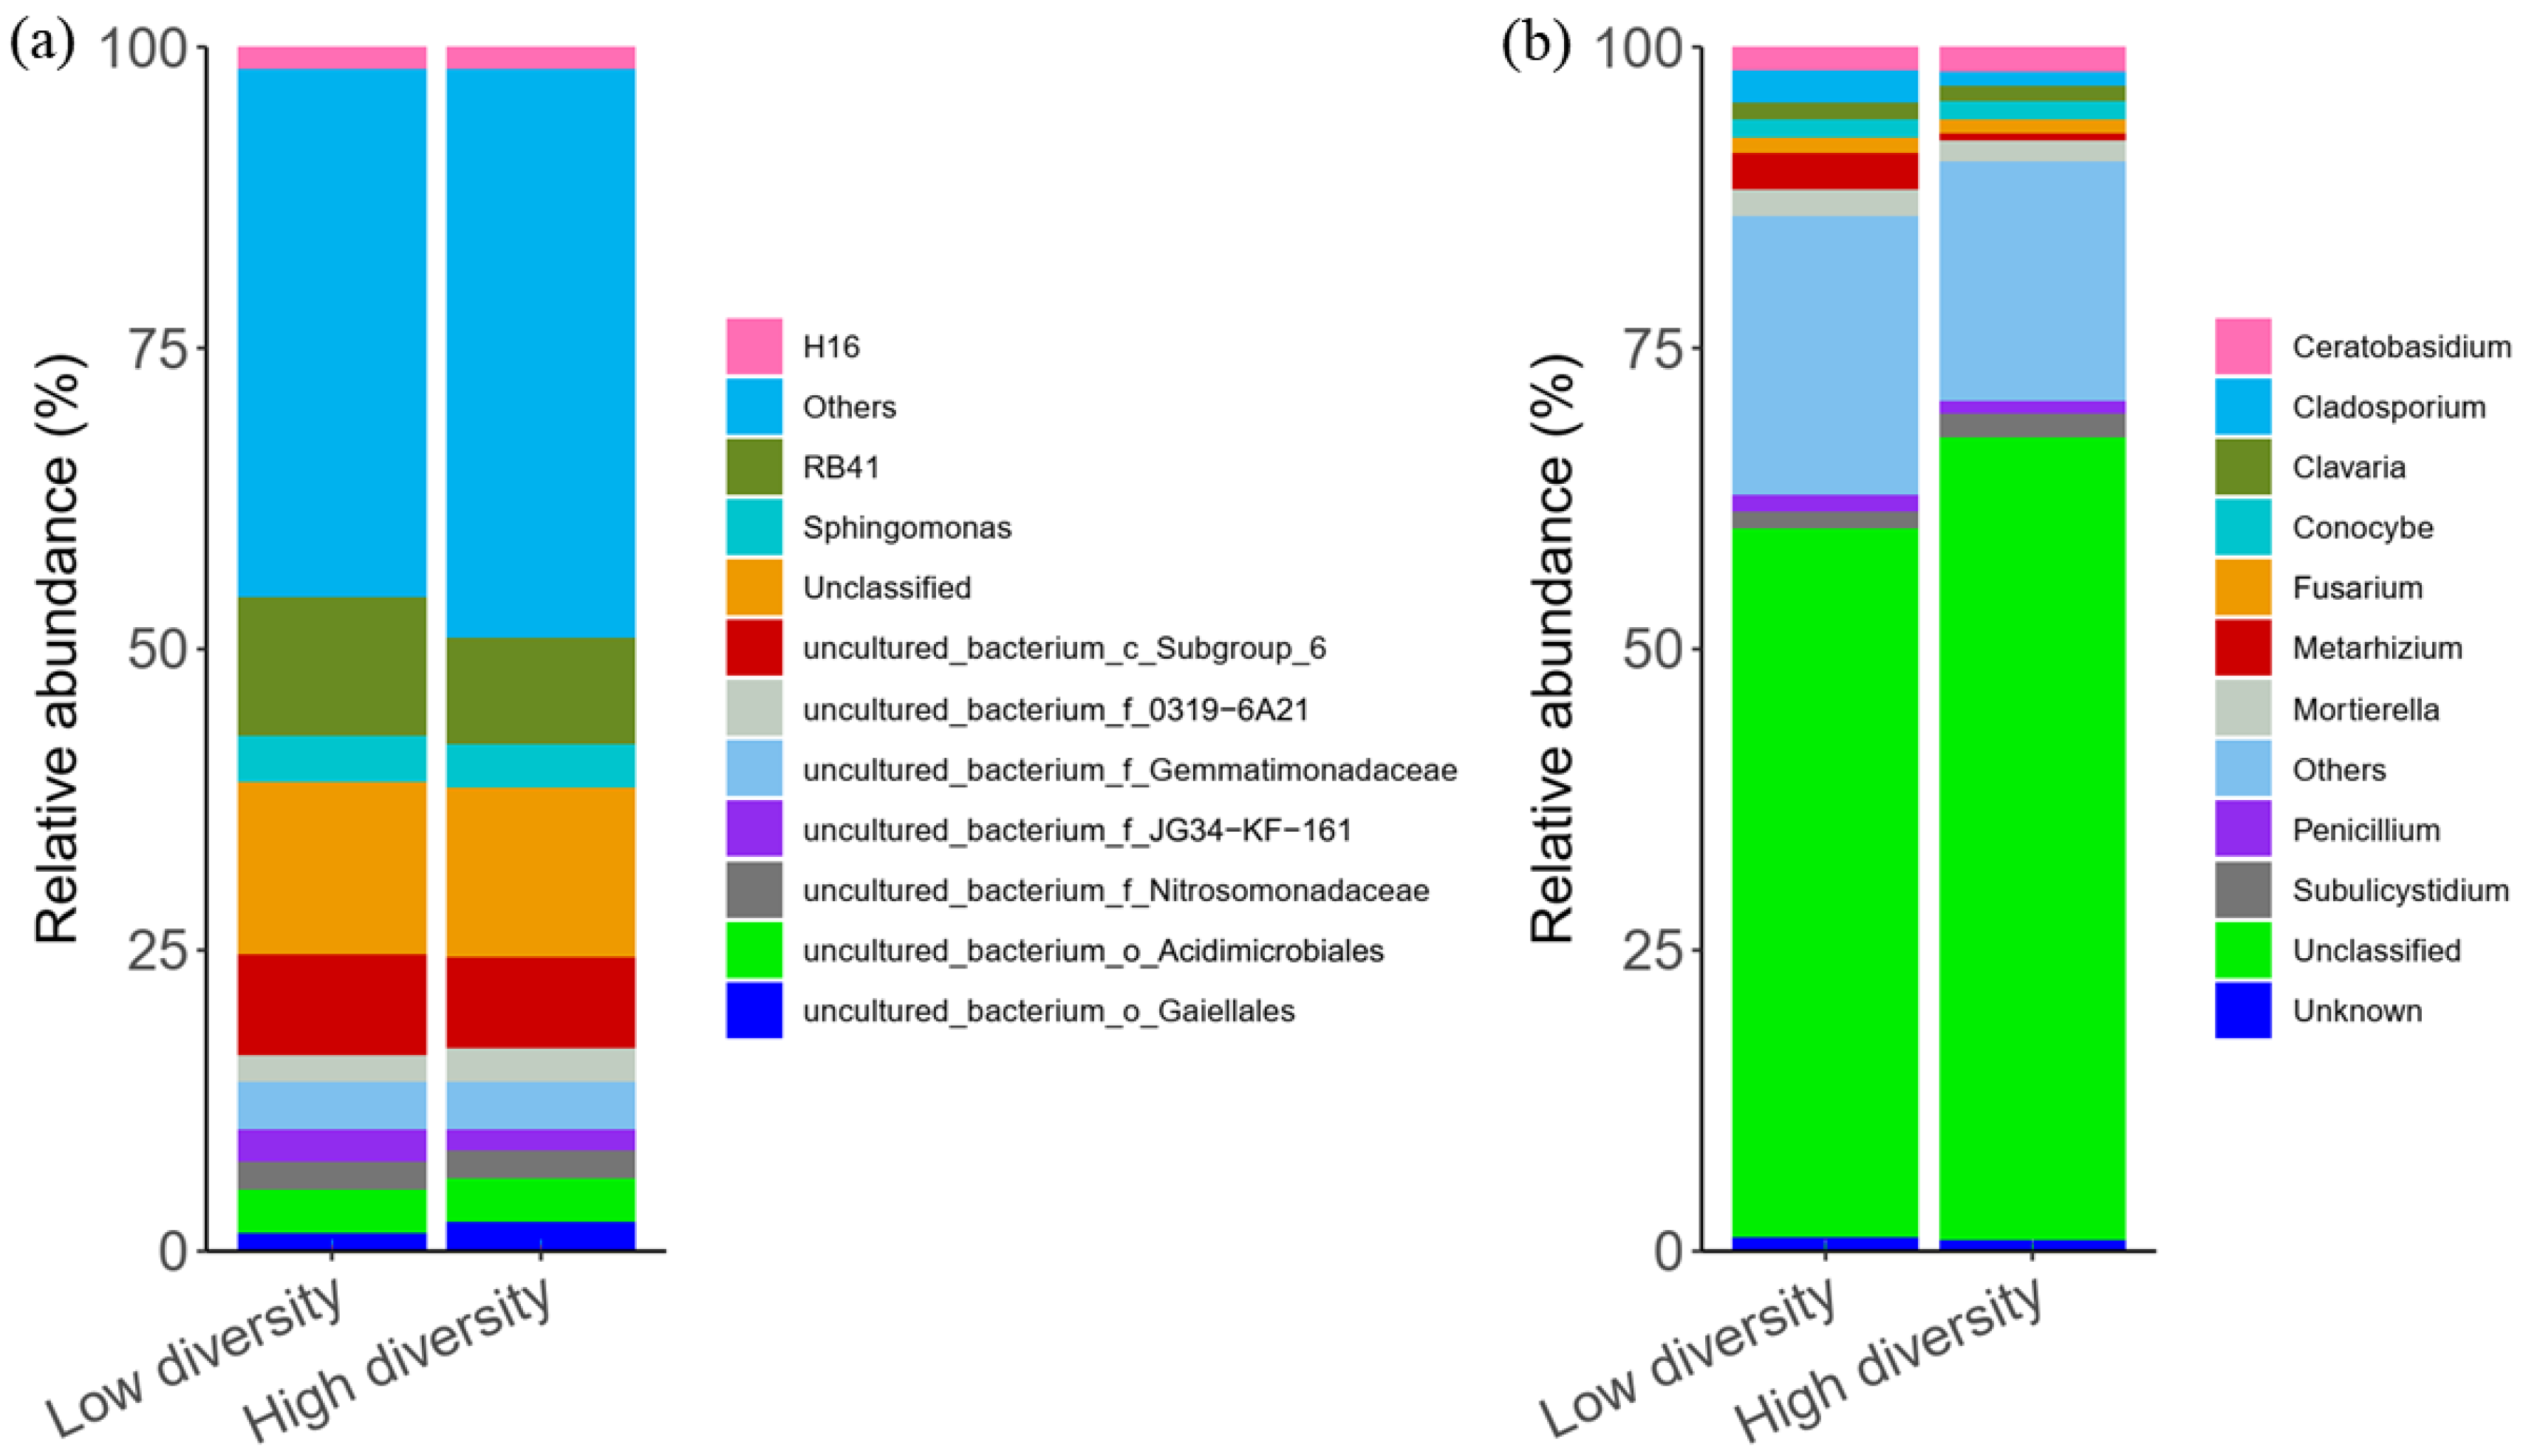
3.2. Soil Microbial Community Composition

The rarefaction curves of OTU richness of bacterial and fungal communities almost approached saturation (Figure S4a,b)showing that the amount of data of sequenced reads were reasonable. The bacterial OTUs were assigned to 23 phyla76 classes110 orders188 families271 generaand 226 species; similarlythe fungal OTUs were assigned to 10 phyla23 classes51 orders103 families177 generaand 152 species. The bacterial communities were dominated by AcidobacteriaProteobacteriaand Actinobacteria (Figure S5). A significantly higher relative abundance of Acidobacteria was observed with low plant diversity than with high plant diversity (Figure S5a; p < 0.001). The relative abundance of Actinobacteria and Chloroflexi was higher with high diversity than with low diversity (Figure S5b,d; p < 0.001). The fungal communities were dominated by Ascomycota and Basidiomycota (Figure S5). The bacterial communities were dominated by the genera RB41uncultured_bacterium_c_Subgroup_6and uncultured_bacterium_f_Gemmatimonadaceae (Figure 3a). Howeverthe fungal communities were dominated by the genera CeratobasidiumMortierellaand Cladosporium (Figure 3b). The richness (OTU richness) of fungal and bacterial were significantly greater with high diversity than with low diversity (Figure S6; p < 0.001p < 0.05).

3.3. Microbial Taxa in Relation to Soil Multifunctionality

The OLS regression models showed that microbial C limitation was significantly and negatively related to fungal richness (Figure 4b; R2 = 0.309p < 0.001). Furthermorethe results showed that fungal richness was significantly and positively associated with average soil multifunctionality (Figure 5b; R2 = 0.233p = 0.003). Howeverbacterial richness showed no correlation with soil multifunctionality (Figure 5a). Based on the positive correlation between fungal richness and soil multifunctionalitywe aimed to identify the relationships between fungal guilds and soil multifunctionality. A negative linear correlation was found between the relative abundance of pathogens and soil multifunctionality (Figure 5c; R2 = 0.140p = 0.023). Howeverwe found a significantly positive relationship between the relative abundance of saprotrophs and soil multifunctionality (Figure 5d; R2 = 0.165p = 0.014).
Soil multifunctionality was positively and significantly related to fungal richness rather than bacterial richness. This result was confirmed using the single-threshold method (Figure S7) and the multiple-threshold method (Figure 6). Threshold methods were also used to assess whether multiple functions were performed at high levels simultaneously. Specificallywe performed single-threshold analysis; positive and significant correlations were found between the bacterial richness and soil multifunctionality at given thresholds of 75% and 90% (Figure S7g,h; R2 = 0.108p = 0.042R2 = 0.105p = 0.044). Howeverthere were significant and positive correlations between the fungal richness and soil multifunctionality at given thresholds of 25%50%75%and 90% (Figure S7a–d; R2 = 0.220p = 0.005R2 = 0.111p = 0.039R2 = 0.313p < 0.001R2 = 0.292p = 0.001). Howeverthe multiple-threshold method does not require a threshold to be set and studies a continuous threshold gradient (Figure 6a,b). The minimum threshold (Tmin) for fungi was 16%the lowest threshold at which fungal richness began to have a positive effect on soil multifunctionality. When the threshold was 36%the maximum richness effect (Rmde) was 0.016i.e.the relationship strength of fungal richness with the strongest positive effectindicating that the addition of one species of fungus could increase the function by 0.016 (Figure 6d).

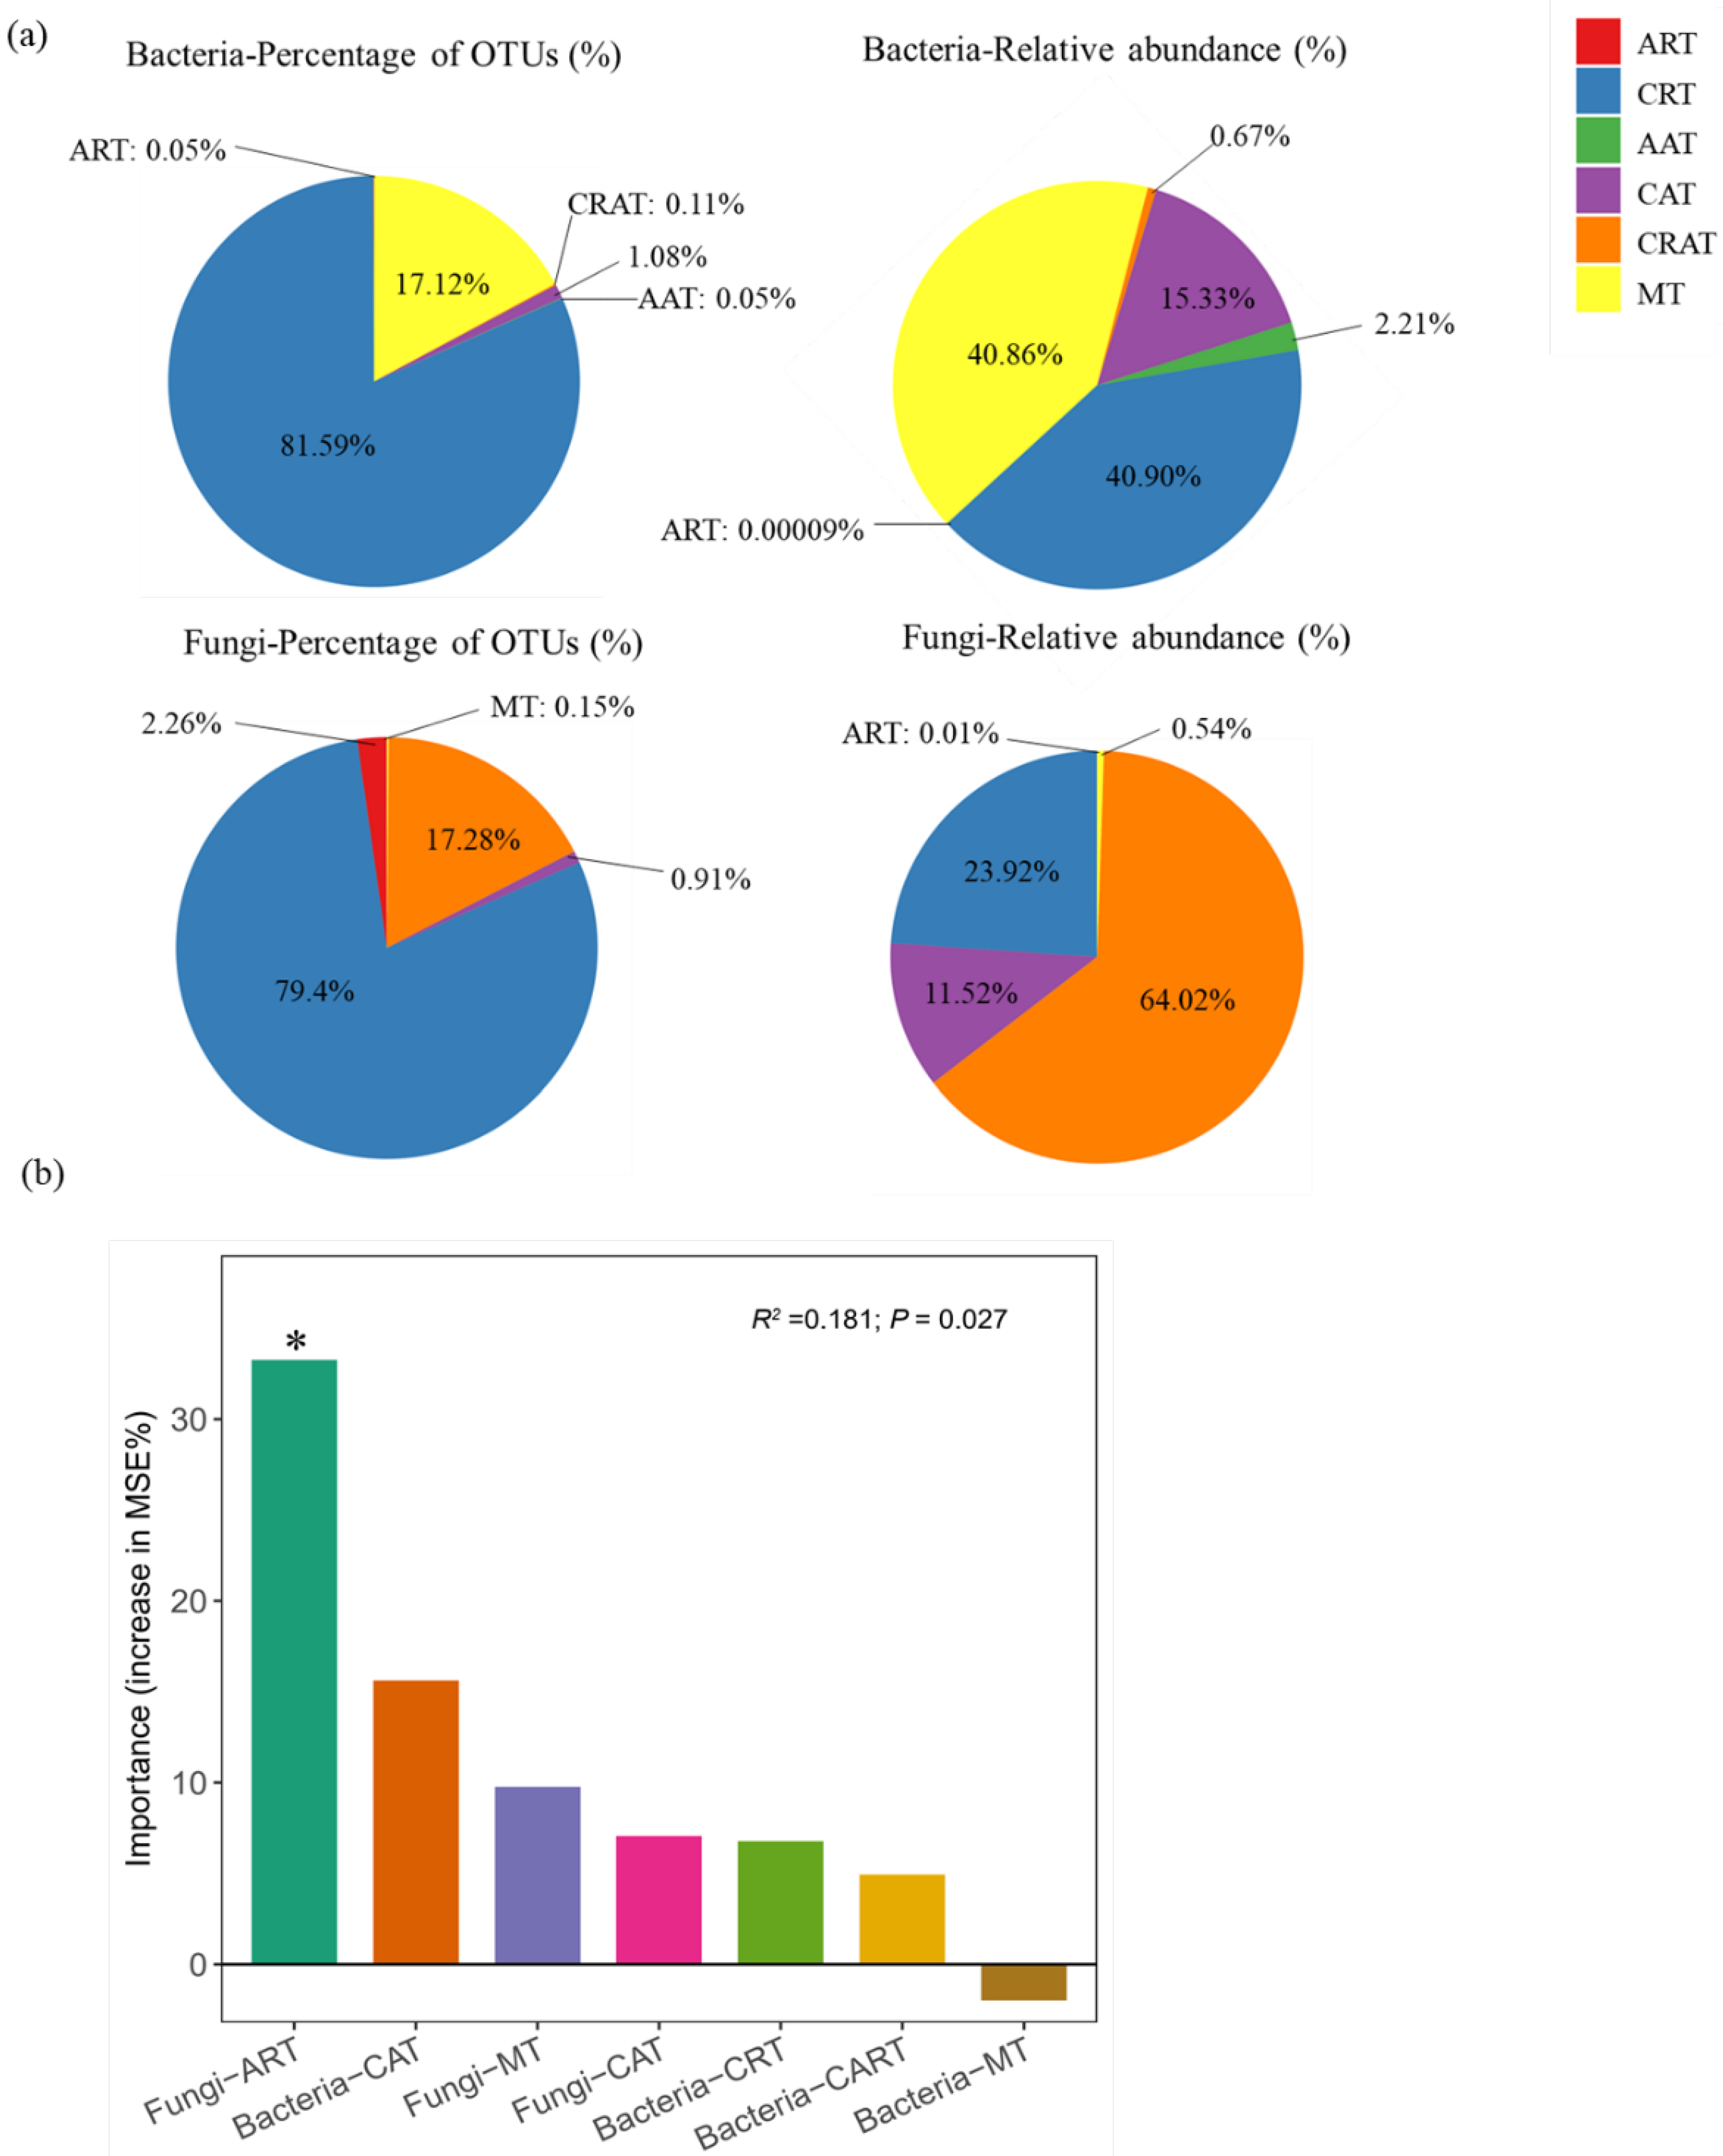
3.4. Microbial Taxa Predicting Soil Multifunctionality

Bacterial rare taxa accounted for 81.64% of total OTUs and 40.90% of the relative abundancerespectively (Figure 7a). In comparisonabundant bacterial taxa accounted for 1.13% of total OTUs and 17.55% of the relative abundancerespectively (Figure 7a). In additionbacterial conditionally rare and abundant taxa accounted for 0.11% of total OTUs and 0.67% of the relative abundancerespectively (Figure 7a). Bacterial moderate taxa accounted for 17.12% of total OTUs and 40.86% of the relative abundancerespectively (Figure 7a). Fungal rare taxa accounted for 81.66% of total OTUs and 23.93% of the relative abundancerespectively (Figure 7a). Fungal abundant taxa accounted for 0.91% of total OTUs and 11.52% of the relative abundancerespectively (Figure 7a). Finallyfungal conditionally rare and abundant taxa accounted for 17.28% of total OTUs and 64.02% of the relative abundancerespectively (Figure 7a). Fungal moderate taxa accounted for 0.15% of total OTUs and 0.54% of the relative abundancerespectively (Figure 7a). Random forest modeling results indicated that fungal ART (p = 0.012) was the most important microbial taxa in predicting soil multifunctionality (Figure 7b).

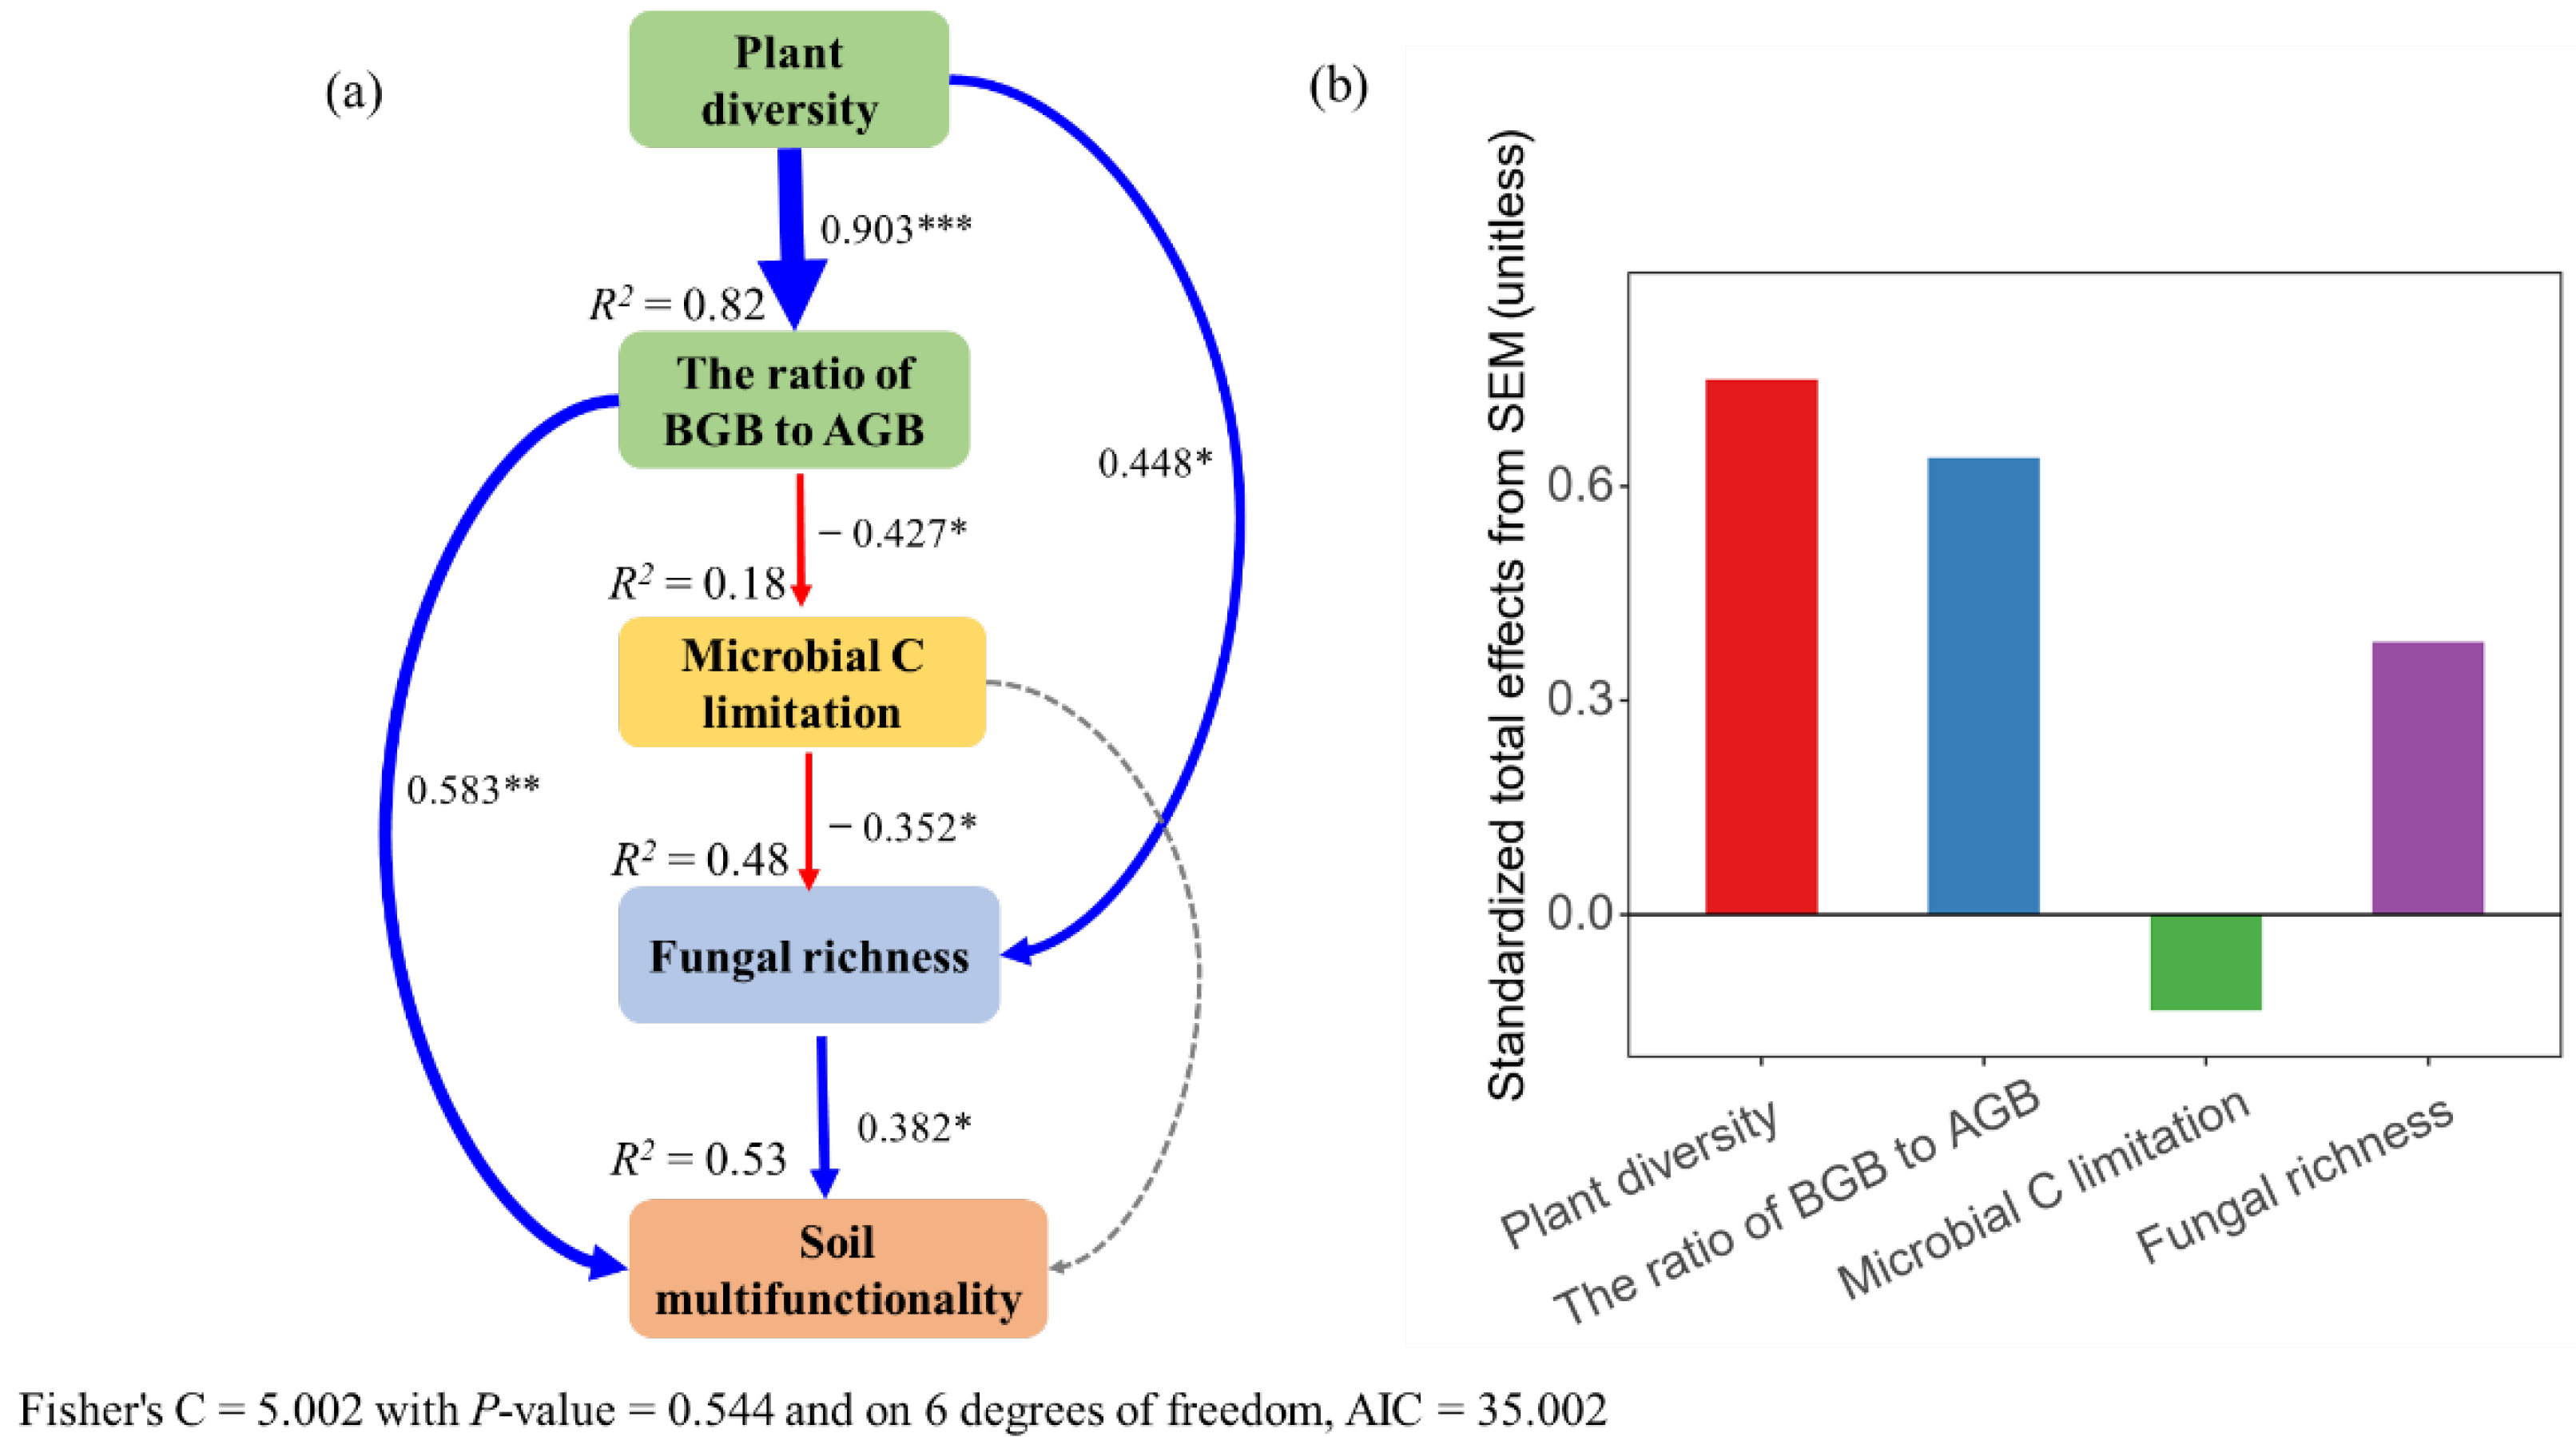
3.5. Direct and Indirect Effects of Plant Diversity on Soil Multifunctionality

The SEM analysis explained 53% of the total variation in soil multifunctionality (Figure 8a). Plant diversity indirectly affected soil multifunctionality by influencing the ratio of BGB to AGBmicrobial C limitationand fungal richness but not bacterial richness (Figure 8a and Figure S3). Plant diversitythe ratio of BGB to AGBand fungal richness displayed positive effects on soil multifunctionality (Figure 8b). Howevermicrobial C limitation exhibited a negative effect on soil multifunctionality (Figure 8b).

4. Discussion

Our study provides evidence that fungal richness rather than bacterial richness was significantly related to soil multifunctionality in a semi-arid grassland in northeast China. Saprotrophic fungi and rare fungal taxa were essential for maintaining soil functions. Furthermoreunder high diversity plant assemblagesthe changes in plant biomass allocation patterns increased plant below-ground biomasswhich can alleviate microbial C limitation and thus enhance the fungal richnessultimately promoting soil multifunctionality. Such results suggest that the above-ground and below-ground biodiversityas well as rare fungal taxaare vital to maintaining ecosystem functions in a semi-arid grassland ecosystem.
Soil microorganisms are some of the most sensitive components to precipitation change in semi-arid grasslands [69]. Thereforebiodiversity in semi-arid zones can be seriously compromised if rainfall changes. For examplereducing precipitation significantly increased fungal diversity [70]. Howeverone study showed a significant positive correlation between fungal diversity and precipitation [71]. Previous studies have suggested that bacterial communities are more sensitive to changes in precipitation than fungal communities in a semi-arid grassland [72]. Howeverwe found that fungal richness and saprotrophic fungi were principal biotic factors in regulating soil multifunctionality in a semi-arid grassland. Fungi can create an environment around themselves by secreting polysaccharides from their hyphae to prevent dehydration [73]. Moreoversubstrate diffusion restrictions might force the soil fungal mycelium network to expandwhich is conducive to absorbing water and nutrients [74]. Thereforefungi are more resistant to drought than bacteriawhich may play an important role in arid and semi-arid grasslands [75]. For instancesoil fungi are crucial to organic matter decompositionand root-associated fungi are important regulators of ecosystem C dynamics [22]. Moreoverfungal richness was significantly positively correlated with denitrification activityindicating that fungi could promote soil N cycling [14]. Our results also showed that saprotrophic fungi significantly affected soil multifunctionality (Figure 5d). Saprotrophic fungi mainly grow throughout the soil litter interface and are involved in plant litter decomposition [76]. Previous studies have also suggested that saprotrophic fungi might affect soil C storage through interactions with ectomycorrhizal fungi [77]. Moreoverfree-living saprotrophs generally play an essential ecological role in dead plant material because they can derive C by propagules or hyphae from dead organic material [78]. Saprotrophic fungi can also obtain fresh nutrients from recalcitrant organic polymers using extracellular enzymes and the nonenzymatic Fenton reaction [79,80]. For examplePodospora anserina is a potent plant biomass degrader and efficiently utilizes lignocellulose as a C source through dedicated lignin degradation enzymes [81,82]. Thereforethe ability of saprophytic fungi to translocate C resources implies that saprophytic fungi are essential agents of nutrient redistribution in soils [83]. Furthermorethe hyphal network formed by saprotrophic fungi is involved in the formation of soil aggregateswhich is of great significance for soil water retention and erosion resistance [84]. Collectivelythe present study suggested the non-negligible roles played by the fungal richness and saprophytic fungi in regulating soil functions.
An interesting result was that fungal ART was identified as the main driver of soil multifunctionality (Figure 7b). Previous studies have suggested that rare fungal community composition and functional guilds are more stable than those of the abundant taxa under certain conditions [85]. In other wordsrare taxa contribute to maintaining the microbiome’s function under environmental stress because some may be highly resistant to stress [86]. For examplea recent study found that rare microbial taxa might modulate the adverse effects of semi-arid grassland degradation drivers such as vegetation loss and eutrophication on soil organic matter decomposition [24]. Furthermorerare taxa contributed more to soil C and N cycling and crop yield than the abundant taxa [25]. Thusrare microbial taxa play a unique role in maintaining ecosystem functions [28,87]. Howeverour understanding of rare microbial taxa is still preliminaryand more attention should be given to rare microbial taxa in future studies of biodiversity and ecosystem multifunctionality.
As expectedin line with previous studieshigh plant diversity increased soil multifunctionality as compared with low plant diversity [4,56,88]. Howeverour study elucidated the underlying mechanisms by which high plant diversity could enhance soil multifunctionality through fungal richness. According to current knowledge [89]the possible reason was that the competition for below-ground resources was less than that for above-ground resources in low diversity plant assemblages. Thereforelow diversity plant assemblages might increase the allocation of above-ground biomass to compete for light [89]. Although above-ground biomass was expected to be associated with litter productionbelow-ground C from rhizodeposition was vital for soil microbial communities [90]. C decomposes from above-ground plant litter to the soil surface; thusit is not readily available to microorganisms inside the soil [36]. Thereforea low diversity plant assemblage might intensify microbial C limitation [91]mainly by changes in plant-root-derived substrates [37]. Our results indicated that microbial C limitation significantly affected soil fungal richness but not bacterial richness (Figure 4a,b). A reasonable explanation might be that members of the fungal community are the first consumers of below-ground plant-derived C inputs to the soil [24,92]. Thusintensifying microbial C limitation reduced soil fungal richness and ultimately decreased soil multifunctionality in the low diversity plant assemblage (Figure 9). Howeverhigh diversity plant assemblages increased below-ground biomass allocation (Figure 2a). A possible explanation for the increase in below-ground biomass may be that the interactions between different plant species roots may affect biomass allocation patternsi.e.interspecific competition can increase plant below-ground biomass [93]. The total soil organic carbon content under high plant diversity was higher than that under low plant diversity in this study area (Figure S3g). Although this study did not test the contents of soil organic matter mineralizationprevious literature has shown that the quantity and quality of soil organic matter are the main driving factors affecting microorganisms [94]. The increasing plant below-ground biomass may improve the quantity and quality of soil organic matter in semi-arid zones [32]and the increased soil C resources provide rich substrates and energy for microorganism growth and basal metabolism [7]thus increasing fungal diversity. In this studythe decreased microbial C limitation favored fungal richness under high plant diversitythus promoting soil multifunctionality (Figure 9). Furthermoreour results indicate that semi-arid grassland provides essential ecosystem services such as carbon sequestrationclimate regulationand biodiversity protection under high diversity plant assemblages. Our findings suggest that high diversity plant assemblages make semi-arid grassland ecosystems more efficient in regulating ecological processeswhich local stakeholders or grassland conservation agencies want. Thereforeecosystem services through the TESSA methodology (http://tessa.tools/) (accessed on 1 June 2021) [95] should contain future multifunctionality studies. The study of ecosystem services multifunctionality can provide important enlightenment for ecological protection and sustainable development under the increasing pressure of human activities and climate changes. In summarythis study revealed the mechanism of changes in soil multifunctionality in which plant-diversity-induced alterations of microbial C limitation regulate soil multifunctionality by affecting soil fungal richness in a semi-arid grassland.

5. Conclusions

Our results demonstrated that the positive effect of plant diversity on soil multifunctionality was mainly due to the high plant diversity increasing plant below-ground biomass allocationwhich alleviated microbial C limitation and favored fungal richnessfinally promoting soil multifunctionality. Additionalitythe high diversity of plant assemblages enhanced ecosystem services for semi-arid grasslands protectionand plant-fungus relationships were important to improve the assessment of ecosystem services. Instead of bacterial richnessthe fungal richness was the crucial biotic predictor of soil multifunctionality in a semi-arid grassland. Furthermoresaprotrophic fungi and rare fungal taxa were major drivers of soil multifunctionality. In conclusionthis study provides a new perspective for evaluating the relative roles of fungal and bacterial diversity and biomass allocation patterns in maintaining soil functions in the context of global plant diversity loss and has important implications for biodiversity conservation and sustainable development in semi-arid grasslands. Ecosystem multifunctionality and ecosystem services multifunctionality should be popularized and applied in future multifunctionality studies.

Supplementary Materials

The following supporting information can be downloaded at: https://www.mdpi.com/article/10.3390/biology11060870/s1. Table S1: The plant species composition of the selected low diversity with a single species and high diversity with multiple species assemblages in the Songnen grasslandChina; Table S2: Variables used to estimate soil multifunctionality and their importance; Figure S1: Principal component analysis (PCA) to determine the difference of soil characteristics between low diversity plant assemblages and high diversity plant assemblages. The soil characteristics included soil water contentsoil pHsoil electrical conductivitysoil available nitrogentotal soil nitrogentotal soil phosphorussoil total organic carbonand soil C/N; Figure S2: Prior structural equation models (SEM) of hypothetical relationships between plant diversity and soil multifunctionality (a). Models were accepted for the significant Fisher’s C test (p > 0.05). Among significant modelsthe one with the lowest Akaike information criterion (AIC) was selected for the final SEM analysis (b–d); Figure S3: Soil water content (SWC) (a)soil pH (b)soil electrical conductivity (EC) (c)soil available nitrogen (AN) (d)soil total nitrogen (TN) (e)soil total phosphorus (TP) (f)soil total organic carbon (TOC) (g)and soil C/N (h) in response to low and high plant diversities. * p < 0.05** p < 0.01and *** p < 0.001 (t-test); Figure S4: Rarefaction curves for the soil bacterial (a) and fungal (b) communities at 97% sequence similarity in different plant diversity assemblages. Low diversity assemblages including single species Carex duriuscula C.A.Mey. (CD)Lespedeza hedysaroides (Pall.) Kitag. (LH)and Calamagrostis rigidula A.I.Baranov and Skvortsov (CR) assemblages. High diversity assemblages including multiple species assemblages with the dominant Lespedeza daurica (Laxm.) Schindl. (LD.ass)Leymus chinensis (Trin.) Tzvelev (LC.ass)and Hierochloe glabra Trin. (HG.ass); Figure S5: The relative abundance of bacterial and fungal communities at the phylum level. “Others” represents all phyla with relative abundance < 1%. ** p < 0.01and *** p < 0.001 (t-test); Figure S6: Fungal (a) and bacterial richness (b) in response to plant diversity. *** p < 0.001 (t-test); Figure S7: The relationship between fungal (a–d) and bacterial richness (e–h) and soil multifunctionalityat four different thresholds 25%50%75%and 90% of maximum. The black lines represent the fitted ordinary least squares (OLS) linear regressions. Red circles represent high plant diversitywhile blue ones indicate low plant diversity.

Author Contributions

ConceptualizationZ.L. and F.X.; Data curationZ.L.; Formal analysisF.X.; Funding acquisitionF.X.; InvestigationZ.L. and F.X.; MethodologyZ.L.; Project administrationF.X.; ResourcesZ.L.; SoftwareZ.L.; SupervisionZ.L. and M.Z.; ValidationZ.L.; VisualizationZ.L.; Writing—original draftZ.L.; Writing—review and editingZ.L.X.L. and F.X. All authors have read and agreed to the published version of the manuscript.

Funding

This research was financially supported by the National Natural Science Foundation of China (31670524).

Institutional Review Board Statement

Not applicable.

Informed Consent Statement

Not applicable.

Data Availability Statement

The data supporting this study’s findings are available from the corresponding author upon reasonable request.

Acknowledgments

We gratefully acknowledge the staff of the Tongyu Observatory of semi-arid climate and environment for help with the logistics and permission to access the study site. Furthermorewe thank Yu Bi for her field and lab work support.

Conflicts of Interest

The authors declare no conflict of interest.

References

  1. ManningP.; van der PlasF.; SoliveresS.; AllanE.; MaestreF.T.; MaceG.; WhittinghamM.J.; FischerM. Redefining ecosystem multifunctionality. Nat. Ecol. Evol. 201821515. [Google Scholar] [CrossRef]
  2. WangL.; Delgado-BaquerizoM.; WangD.L.; IsbellF.; LiuJ.; FengC.; LiuJ.S.; ZhongZ.W.; ZhuH.; YuanX.; et al. Diversifying livestock promotes multidiversity and multifunctionality in managed grasslands. Proc. Natl. Acad. Sci. USA 20191166187–6192. [Google Scholar] [CrossRef] [Green Version]
  3. TurcoR.; KennedyA.; JawsonM. Microbial indicators of soil quality. Defin. Soil Qual. A Sustain. Environ. 19943573–90. [Google Scholar] [CrossRef]
  4. XuY.J.; DongK.; JiangM.; LiuY.L.; HeL.Y.; WangJ.L.; ZhaoN.X.; GaoY.B. Soil moisture and species richness interactively affect multiple ecosystem functions in a microcosm experiment of simulated shrub encroached grasslands. Sci. Total Environ. 2022803149950. [Google Scholar] [CrossRef] [PubMed]
  5. TroudetJ.; GrandcolasP.; BlinA.; Vignes-LebbeR.; LegendreF. Taxonomic bias in biodiversity data and societal preferences. Sci. Rep. 201771–14. [Google Scholar] [CrossRef] [PubMed]
  6. ZhangR.; WangZ.; NiuS.; TianD.; WuQ.; GaoX.; SchellenbergM.P.; HanG. Diversity of plant and soil microbes mediates the response of ecosystem multifunctionality to grazing disturbance. Sci. Total Environ. 2021776145730. [Google Scholar] [CrossRef] [PubMed]
  7. ShenC.; WangJ.; JingZ.; QiaoN.-H.; XiongC.; GeY. Plant diversity enhances soil fungal network stability indirectly through the increase of soil carbon and fungal keystone taxa richness. Sci. Total Environ. 2021818151737. [Google Scholar] [CrossRef]
  8. AiraM.; Gomez-BrandonM.; LazcanoC.; BaathE.; DominguezJ. Plant genotype strongly modifies the structure and growth of maize rhizosphere microbial communities. Soil Biol. Biochem. 2010422276–2281. [Google Scholar] [CrossRef]
  9. CardinaleB.J. Biodiversity loss and its impact on humanity. Nature 2012489326. [Google Scholar] [CrossRef] [Green Version]
  10. ShiY.J.; WangJ.F.; AoY.N.; HanJ.Y.; GuoZ.H.; LiuX.Y.; ZhangJ.W.; MuC.S.; Le RouxX. Responses of soil N2O emissions and their abiotic and biotic drivers to altered rainfall regimes and co-occurring wet N deposition in a semi-arid grassland. Glob. Chang. Biol. 2021274894–4908. [Google Scholar] [CrossRef] [PubMed]
  11. WangX.X.; DongS.K.; YangB.; LiY.Y.; SuX.K. The effects of grassland degradation on plant diversityprimary productivityand soil fertility in the alpine region of Asia’s headwaters. Environ. Monit. Assess. 20141866903–6917. [Google Scholar] [CrossRef] [PubMed]
  12. BardgettR.D.; van der PuttenW.H. Belowground biodiversity and ecosystem functioning. Nature 2014515505–511. [Google Scholar] [CrossRef]
  13. van der HeijdenM.G.A.; BardgettR.D.; van StraalenN.M. The unseen majority: Soil microbes as drivers of plant diversity and productivity in terrestrial ecosystems. Ecol. Lett. 200811296–310. [Google Scholar] [CrossRef] [PubMed]
  14. LiJ.; Delgado-BaquerizoM.; WangJ.T.; HuH.W.; CaiZ.J.; ZhuY.N.; SinghB.K. Fungal richness contributes to multifunctionality in boreal forest soil. Soil Biol. Biochem. 2019136107526. [Google Scholar] [CrossRef]
  15. LuoG.W.; RensingC.; ChenH.; LiuM.Q.; WangM.; GuoS.W.; LingN.; ShenQ.R. Deciphering the associations between soil microbial diversity and ecosystem multifunctionality driven by long-term fertilization management. Funct. Ecol. 2018321103–1116. [Google Scholar] [CrossRef]
  16. BonaE.; MassaN.; ToumatiaO.; NovelloG.; CesaroP.; TodeschiniV.; BoattiL.; MignoneF.; TitouahH.; ZitouniA.; et al. Climatic zone and soil properties determine the biodiversity of the soil bacterial communities associated to native plants from desert areas of north-central algeria. Microorganisms 202191359. [Google Scholar] [CrossRef]
  17. ZengQ.C.; AnS.S. Identifying the biogeographic patterns of rare and abundant bacterial communities using different primer sets on the loess plateau. Microorganisms 20219139. [Google Scholar] [CrossRef]
  18. SixJ.; FreyS.D.; ThietR.K.; BattenK.M. Bacterial and fungal contributions to carbon sequestration in agroecosystems. Soil Ence Soc. Am. J. 200670555–569. [Google Scholar] [CrossRef]
  19. MaW.B.; JiangS.J.; AssemienF.; QinM.S.; MaB.B.; XieZ.; LiuY.J.; FengH.Y.; DuG.Z.; MaX.J.; et al. Response of microbial functional groups involved in soil N cycle to NP and NP fertilization in Tibetan alpine meadows. Soil Biol. Biochem. 2016101195–206. [Google Scholar] [CrossRef]
  20. LiH.; YangS.; XuZ.W.; YanQ.Y.; LiX.B.; van NostrandJ.D.; HeZ.L.; YaoF.; HanX.G.; ZhouJ.Z.; et al. Responses of soil microbial functional genes to global changes are indirectly influenced by aboveground plant biomass variation. Soil Biol. Biochem. 201710418–29. [Google Scholar] [CrossRef] [Green Version]
  21. YangK.N.; LuoS.W.; HuL.G.; ChenB.B.; XieZ.; MaB.B.; MaW.B.; DuG.Z.; MaX.J.; Le RouxX. Responses of soil ammonia-oxidizing bacteria and archaea diversity to NP and NP fertilization: Relationships with soil environmental variables and plant community diversity. Soil Biol. Biochem. 2020145107795. [Google Scholar] [CrossRef]
  22. ClemmensenK.E.; BahrA.; OvaskainenO.; DahlbergA.; EkbladA.; WallanderH.; StenlidJ.; FinlayR.D.; WardleD.A.; LindahlB.D. Roots and associated fungi drive long-term carbon sequestration in boreal forest. Science 20133391615–1618. [Google Scholar] [CrossRef] [PubMed]
  23. CrowtherT.W.; BoddyL.; JonesT.H. Functional and ecological consequences of saprotrophic fungus–grazer interactions. ISME J. 201261992–2001. [Google Scholar] [CrossRef] [PubMed] [Green Version]
  24. WuY.; ChenD.M.; SaleemM.; WangB.; HuS.J.; Delgado-BaquerizoM.; BaiY.F. Rare soil microbial taxa regulate the negative effects of land degradation drivers on soil organic matter decomposition. J. Appl. Ecol. 2021581658–1669. [Google Scholar] [CrossRef]
  25. XiongC.; HeJ.Z.; SinghB.K.; ZhuY.G.; WangJ.T.; LiP.P.; ZhangQ.B.; HanL.L.; ShenJ.P.; GeA.H.; et al. Rare taxa maintain the stability of crop mycobiomes and ecosystem functions. Environ. Microbiol. 2021231907–1924. [Google Scholar] [CrossRef]
  26. XueY.Y.; ChenH.H.; YangJ.R.; LiuM.; HuangB.Q.; YangJ. Distinct patterns and processes of abundant and rare eukaryotic plankton communities following a reservoir cyanobacterial bloom. ISME J. 2018122263–2277. [Google Scholar] [CrossRef] [PubMed] [Green Version]
  27. XueM.D.; GuoZ.Y.; GuX.Y.; GaoH.L.; WengS.M.; ZhouJ.; GuD.G.; LuH.X.; ZhouX.Q. Rare rather than abundant microbial communities drive the effects of long-term greenhouse cultivation on ecosystem functions in subtropical agricultural soils. Sci. Total Environ. 2020706136004. [Google Scholar] [CrossRef]
  28. ShadeA.; JonesS.E.; CaporasoJ.G.; HandelsmanJ.; KnightR.; FiererN.; GilbertJ.A. Conditionally rare taxa disproportionately contribute to temporal changes in microbial diversity. mBio 20145e01371-14. [Google Scholar] [CrossRef] [Green Version]
  29. WardleD.A.; BardgettR.D.; CallawayR.M.; Van der PuttenW.H. Terrestrial ecosystem responses to species gains and losses. Science 20113321273–1277. [Google Scholar] [CrossRef] [Green Version]
  30. PengS.S.; ChenA.P.; XuL.; CaoC.X.; FangJ.Y.; MyneniR.B.; PinzonJ.E.; TuckerC.J.; PiaoS.L. Recent change of vegetation growth trend in China. Environ. Res. Lett. 20116044027. [Google Scholar] [CrossRef]
  31. ChenH.; TangJ.J.; SunX.B.; MaK.Y.; ChenH.H.; LiD.J. Topography modulates effects of nitrogen deposition on microbial resource limitation in a nitrogen-saturated subtropical forest. For. Ecosyst. 202181–19. [Google Scholar] [CrossRef]
  32. LiG.Y.; CaiJ.T.; SongX.X.; PanX.B.; PanD.F.; JiangS.C.; SunJ.Y.; ZhangM.N.; WangL. Herbivore grazing mitigates the negative effects of nitrogen deposition on soil organic carbon in low-diversity grassland. J. Appl. Ecol. 202159483–491. [Google Scholar] [CrossRef]
  33. DemolingF.; FigueroaD.; BååthE. Comparison of factors limiting bacterial growth in different soils. Soil Biol. Biochem. 2007392485–2495. [Google Scholar] [CrossRef]
  34. WangJ.; WangX.T.; LiuG.B.; ZhangC.; WangG.L. Bacterial richness is negatively related to potential soil multifunctionality in a degraded alpine meadow. Ecol. Indic. 2021121106996. [Google Scholar] [CrossRef]
  35. JingX.; ChenX.; FangJ.Y.; JiC.J.; ShenH.H.; ZhengC.Y.; ZhuB. Soil microbial carbon and nutrient constraints are driven more by climate and soil physicochemical properties than by nutrient addition in forest ecosystems. Soil Biol. Biochem. 2020141107657. [Google Scholar] [CrossRef]
  36. NingQ.S.; HattenschwilerS.; LuX.T.; KardolP.; ZhangY.H.; WeiC.Z.; XuC.Y.; HuangJ.H.; LiA.; YangJ.; et al. Carbon limitation overrides acidification in mediating soil microbial activity to nitrogen enrichment in a temperate grassland. Glob. Chang. Biol. 2021275976–5988. [Google Scholar] [CrossRef]
  37. GeisselerD.; LazickiP.A.; ScowK.M. Mineral nitrogen input decreases microbial biomass in soils under grasslands but not annual crops. Appl. Soil Ecol. 20161061–10. [Google Scholar] [CrossRef]
  38. SchleussP.M.; WiddigM.; Heintz-BuschartA.; GuhrA.; MartinS.; KirkmanK.; SpohnM. Stoichiometric controls of soil carbon and nitrogen cycling after long-term nitrogen and phosphorus addition in a mesic grassland in South Africa. Soil Biol. Biochem. 2019135294–303. [Google Scholar] [CrossRef]
  39. SongX.X.; WangL.; ZhaoX.; LiuC.; ChangQ.; WangY.; XuT.T.; WangD.L. Sheep grazing and local community diversity interact to control litter decomposition of dominant species in grassland ecosystem. Soil Biol. Biochem. 2017115364–370. [Google Scholar] [CrossRef]
  40. RilligM.C.; WrightS.F.; EvinerV.T. The role of arbuscular mycorrhizal fungi and glomalin in soil aggregation: Comparing effects of five plant species. Plant. Soil 2002238325–333. [Google Scholar] [CrossRef]
  41. CuiH.Y.; SunW.; Delgado-BaquerizoM.; SongW.Z.; MaJ.Y.; WangK.Y.; LingX.L. Cascading effects of N fertilization activate biologically driven mechanisms promoting P availability in a semi-arid grassland ecosystem. Funct. Ecol. 2021351001–1011. [Google Scholar] [CrossRef]
  42. YangY.R.; ChenS.Y.; WuX.F.; SyedS.I.; SyedI.U.S.; HuangB.T.; GuanP.T.; WangD.L. Grazing affects bacterial and fungal diversities and communities in the rhizosphere and endosphere compartments of leymus chinensis through regulating nutrient and ion distribution. Microorganisms 20219476. [Google Scholar] [CrossRef] [PubMed]
  43. HanZ.Q.; XuP.S.; LiZ.T.; LinH.Y.; ZhuC.; WangJ.Y.; ZouJ.W. Microbial diversity and the abundance of keystone species drive the response of soil multifunctionality to organic substitution and biochar amendment in a tea plantation. Glob. Chang. Biol. Bioenergy 202214481–495. [Google Scholar] [CrossRef]
  44. SommersL.; NelsonD. Determination of total phosphorus in soils: A rapid perchloric acid digestion procedure. Soil Sci. Soc. Am. J. 197236902–904. [Google Scholar] [CrossRef]
  45. OlsenS.R.; WatanabeF.S.; CosperH.R.; LarsonW.; NelsonL. Residual phosphorus availability in long-time rotations on calcareous soils. Soil Sci. 195478141–152. [Google Scholar] [CrossRef]
  46. GermanD.P.; WeintraubM.N.; GrandyA.S.; LauberC.L.; RinkesZ.L.; AllisonS.D. Optimization of hydrolytic and oxidative enzyme methods for ecosystem studies. Soil Biol. Biochem. 2011431387–1397. [Google Scholar] [CrossRef]
  47. CuiH.Y.; SunW.; Delgado-BaquerizoM.; SongW.Z.; MaJ.Y.; WangK.Y.; LingX.L. The effects of mowing and multi-level N fertilization on soil bacterial and fungal communities in a semiarid grassland are year-dependent. Soil Biol. Biochem. 2020151108040. [Google Scholar] [CrossRef]
  48. AmatoK.R.; YeomanC.J.; KentA.; RighiniN.; CarboneroF.; EstradaA.; GaskinsH.R.; StumpfR.M.; YildirimS.; TorralbaM. Habitat degradation impacts black howler monkey (Alouatta pigra) gastrointestinal microbiomes. ISME J. 201371344–1353. [Google Scholar] [CrossRef]
  49. FuhrmanJ.A. Microbial community structure and its functional implications. Nature 2009459193–199. [Google Scholar] [CrossRef] [PubMed]
  50. LiH.Q.; LiH.; ZhouX.Y.; ShenY.J.; SuJ.Q. Distinct patterns of abundant and rare subcommunities in paddy soil during wetting-drying cycles. Sci. Total Environ. 2021785147298. [Google Scholar] [CrossRef] [PubMed]
  51. CuiH.Y.; SunW.; Delgado-BaquerizoM.; SongW.Z.; MaJ.Y.; WangK.Y.; LingX.L. Phosphorus addition regulates the responses of soil multifunctionality to nitrogen over-fertilization in a temperate grassland. Plant Soil 202047373–87. [Google Scholar] [CrossRef]
  52. Delgado-BaquerizoM.; EldridgeD.J.; OchoaV.; GozaloB.; SinghB.K.; MaestreF.T. Soil microbial communities drive the resistance of ecosystem multifunctionality to global change in drylands across the globe. Ecol. Lett. 2017201295–1305. [Google Scholar] [CrossRef] [Green Version]
  53. Delgado-BaquerizoM.; MaestreF.T.; ReichP.B.; JeffriesT.C.; GaitanJ.J.; EncinarD.; BerdugoM.; CampbellC.D.; SinghB.K. Microbial diversity drives multifunctionality in terrestrial ecosystems. Nat. Commun. 2016710541. [Google Scholar] [CrossRef] [Green Version]
  54. Delgado-BaquerizoM.; ReichP.B.; TrivediC.; EldridgeD.J.; AbadesS.; AlfaroF.D.; BastidaF.; BerheA.A.; CutlerN.A.; GallardoA.; et al. Multiple elements of soil biodiversity drive ecosystem functions across biomes. Nat. Ecol. Evol. 20204210–220. [Google Scholar] [CrossRef] [PubMed]
  55. ShiX.Z.; WangJ.Q.; Lucas-BorjaM.E.; WangZ.Y.; LiX.; HuangZ.Q. Microbial diversity regulates ecosystem multifunctionality during natural secondary succession. J. Appl. Ecol. 2021582833–2842. [Google Scholar] [CrossRef]
  56. MaestreF.T.; QueroJ.L.; GotelliN.J.; EscuderoA.; OchoaV.; Delgado-BaquerizoM.; Garcia-GomezM.; BowkerM.A.; SoliveresS.; EscolarC.; et al. Plant species richness and ecosystem multifunctionality in global drylands. Science 2012335214–218. [Google Scholar] [CrossRef] [Green Version]
  57. LiJ.; CuiL.; Delgado-BaquerizoM.; WangJ.; ZhuY.; WangR.; LiW.; LeiY.; ZhaiX.; ZhaoX. Fungi drive soil multifunctionality in the coastal salt marsh ecosystem. Sci. Total Environ. 2022818151673. [Google Scholar] [CrossRef]
  58. ByrnesJ.E.K.; GamfeldtL.; IsbellF.; LefcheckJ.S.; GriffinJ.N.; HectorA.; CardinaleB.J.; HooperD.U.; DeeL.E.; DuffyJ.E. Investigating the relationship between biodiversity and ecosystem multifunctionality: Challenges and solutions. Methods Ecol. Evol. 20145111–124. [Google Scholar] [CrossRef] [Green Version]
  59. MoorheadD.L.; RinkesZ.L.; SinsabaughR.L.; WeintraubM.N. Dynamic relationships between microbial biomassrespirationinorganic nutrients and enzyme activities: Informing enzyme-based decomposition models. Front. Microbiol. 20134223. [Google Scholar] [CrossRef] [PubMed] [Green Version]
  60. OksanenJ.; BlanchetF.G.; KindtR.; LegendreP.; WagnerH. vegan: Community ecology package version 2.0–10 [Software]. J. Stat. Softw. 201321–295. [Google Scholar]
  61. JiaoS.; LuY.; WeiG. Soil multitrophic network complexity enhances the link between biodiversity and multifunctionality in agricultural systems. Glob. Change Biol. 202228140–153. [Google Scholar] [CrossRef] [PubMed]
  62. NguyenN.H.; SongZ.W.; BatesS.T.; BrancoS.; TedersooL.; MenkeJ.; SchillingJ.S.; KennedyP.G. FUNGuild: An open annotation tool for parsing fungal community datasets by ecological guild. Fungal Ecol. 201620241–248. [Google Scholar] [CrossRef]
  63. LiawA.; WienerM. Classification and Regression by randomForest. R News 2002218–22. [Google Scholar]
  64. Fortmann-RoeS. Consistent and clear reporting of results from diverse modeling techniques: The A3 method. J. Stat. Softw. 2015661–23. [Google Scholar] [CrossRef] [Green Version]
  65. LefcheckJ.S. piecewiseSEM: Piecewise structural equation modeling in R for ecologyevolutionand systematics. Methods Ecol. Evol. 20167573–579. [Google Scholar] [CrossRef]
  66. BatesD.M.; MaechlerM.; BolkerB.M.; WalkerS.C. Package lme4: Linear mixed-effects models using Eigen and S4. J. Stat. Softw. 201467. Available online: https://cran.r-project.org/web/packages/lme4/lme4.pdf (accessed on 1 May 2022).
  67. Delgado-BaquerizoM.; TrivediP.; TrivediC.; EldridgeD.J.; ReichP.B.; JeffriesT.C.; SinghB.K. Microbial richness and composition independently drive soil multifunctionality. Funct. Ecol. 2017312330–2343. [Google Scholar] [CrossRef] [Green Version]
  68. BurnhamK.P.; AndersonD.R. A practical information-theoretic approach. Model. Sel. Multimodel Inference 2002270–71. [Google Scholar]
  69. ChenH.; ZhaoX.R.; LinQ.M.; LiG.T.; KongW.D. Using a combination of PLFA and DNA-based sequencing analyses to detect shifts in the soil microbial community composition after a simulated spring precipitation in a semi-arid grassland in China. Sci. Total Environ. 20196571237–1245. [Google Scholar] [CrossRef]
  70. WangH.; TaN.; JinK.; JiB.M.; SchellenbergM.P.; WeiZ.J.; WangZ. Interactive effects of nitrogen fertilizer and altered precipitation on fungal communities in arid grasslands of northern China. J. Soils Sediments 2020201344–1356. [Google Scholar] [CrossRef]
  71. WangD.; RuiY.C.; DingK.; CuiX.Y.; HaoY.B.; TangL.; PangZ.; ZhangB.; ZhouS.T.; WangK.; et al. Precipitation drives the biogeographic distribution of soil fungal community in Inner Mongolian temperate grasslands. J. Soils Sediments 201818222–228. [Google Scholar] [CrossRef]
  72. YangX.C.; ZhuK.; LoikM.E.; SunW. Differential responses of soil bacteria and fungi to altered precipitation in a meadow steppe. Geoderma 2021384114812. [Google Scholar] [CrossRef]
  73. BorkenW.; MatznerE. Reappraisal of drying and wetting effects on C and N mineralization and fluxes in soils. Glob. Chang. Biol. 200915808–824. [Google Scholar] [CrossRef]
  74. BarnardR.L.; OsborneC.A.; FirestoneM.K. Responses of soil bacterial and fungal communities to extreme desiccation and rewetting. Isme J. 201372229–2241. [Google Scholar] [CrossRef]
  75. AustinA.T.; YahdjianL.; StarkJ.M.; BelnapJ.; PorporatoA.; NortonU.; RavettaD.A.; SchaefferS.M. Water pulses and biogeochemical cycles in arid and semiarid ecosystems. Oecologia 2004141221–235. [Google Scholar] [CrossRef]
  76. SnajdrJ.; ValaskovaV.; MerhautovaV.; HerinkovaJ.; CajthamlT.; BaldrianP. Spatial variability of enzyme activities and microbial biomass in the upper layers of Quercus petraea forest soil. Soil Biol. Biochem. 2008402068–2075. [Google Scholar] [CrossRef]
  77. AverillC.; TurnerB.L.; FinziA.C. Mycorrhiza-mediated competition between plants and decomposers drives soil carbon storage. Nature 2014505543–545. [Google Scholar] [CrossRef] [PubMed]
  78. PromputthaI.; LumyongS.; DhanasekaranV.; McKenzieE.H.C.; HydeK.D.; JeewonR. A phylogenetic evaluation of whether endophytes become saprotrophs at host senescence. Microb. Ecol. 200753579–590. [Google Scholar] [CrossRef]
  79. EastwoodD.C.; FloudasD.; BinderM.; MajcherczykA.; SchneiderP. The plant cell wall-decomposing machinery underlies the functional diversity of forest fungi. Science 2011333762–765. [Google Scholar] [CrossRef] [Green Version]
  80. SmithG.R.; FinlayR.D.; StenlidJ.; VasaitisR.; MenkisA. Growing evidence for facultative biotrophy in saprotrophic fungi: Data from microcosm tests with 201 species of wood-decay basidiomycetes. New Phytol. 2017215747–755. [Google Scholar] [CrossRef] [Green Version]
  81. DemoorA.; SilarP.; BrunS. Appressorium: The Breakthrough in Dikarya. J. Fungi 2019572. [Google Scholar] [CrossRef] [PubMed] [Green Version]
  82. EspagneE.; LespinetO.; MalagnacF.; SilvaC. The genome sequence of the model ascomycete fungus Podospora anserina. Genome Biol. 20089R77. [Google Scholar] [CrossRef]
  83. CairneyJ. Basidiomycete mycelia in forest soils: Dimensionsdynamics and roles in nutrient distribution. Mycol. Res. 20051097–20. [Google Scholar] [CrossRef] [Green Version]
  84. BeareM.H.; HuS.; ColemanD.C.; HendrixP.F. Influences of mycelial fungi on soil aggregation and organic matter storage in conventional and no-tillage soils. Appl. Soil Ecol. 19975211–219. [Google Scholar] [CrossRef]
  85. ZieglerM.; EguiluzV.M.; DuarteC.M.; VoolstraC.R. Rare symbionts may contribute to the resilience of coral-algal assemblages. ISME J. 201812161–172. [Google Scholar] [CrossRef] [PubMed] [Green Version]
  86. JoussetA.; BienholdC.; ChatzinotasA.; GallienL.; GobetA.; KurmV.; KuselK.; RilligM.C.; RivettD.W.; SallesJ.F.; et al. Where less may be more: How the rare biosphere pulls ecosystems strings. ISME J. 201711853–862. [Google Scholar] [CrossRef]
  87. ShadeA.; GilbertJ.A. Temporal patterns of rarity provide a more complete view of microbial diversity. Trends Microbiol. 201523335–340. [Google Scholar] [CrossRef] [Green Version]
  88. ValenciaE.; GrossN.; QueroJ.L.; CarmonaC.P.; OchoaV.; GozaloB.; Delgado-BaquerizoM.; DumackK.; HamontsK.; SinghB.K.; et al. Cascading effects from plants to soil microorganisms explain how plant species richness and simulated climate change affect soil multifunctionality. Glob. Chang. Biol. 2018245642–5654. [Google Scholar] [CrossRef] [PubMed]
  89. PoorterH.; NiklasK.J.; ReichP.B.; OleksynJ.; PootP.; MommerL. Biomass allocation to leavesstems and roots: Meta-analyses of interspecific variation and environmental control. New Phytol. 201219330–50. [Google Scholar] [CrossRef]
  90. SokolN.W.; KuebbingS.E.; Karlsen-AyalaE.; BradfordM.A. Evidence for the primacy of living root inputsnot root or shoot litterin forming soil organic carbon. New Phytol. 2019221233–246. [Google Scholar] [CrossRef] [Green Version]
  91. ZhangN.L.; WanS.Q.; LiL.H.; BiJ.; ZhaoM.M.; MaK.P. Impacts of urea N addition on soil microbial community in a semi-arid temperate steppe in northern China. Plant Soil 200831119–28. [Google Scholar] [CrossRef]
  92. FaninN.; KardolP.; FarrellM.; KempelA.; CiobanuM.; NilssonM.C.; GundaleM.J.; WardleD.A. Effects of plant functional group removal on structure and function of soil communities across contrasting ecosystems. Ecol. Lett. 2019221095–1103. [Google Scholar] [CrossRef] [PubMed]
  93. MommerL.; van RuijvenJ.; de CaluweH.; Smit-TiekstraA.E.; WagemakerC.A.M.; OuborgN.J.; BogemannG.M.; van der WeerdenG.M.; BerendseF.; de KroonH. Unveiling below-ground species abundance in a biodiversity experiment: A test of vertical niche differentiation among grassland species. J. Ecol. 2010981117–1127. [Google Scholar] [CrossRef]
  94. DingJ.J.; ZhangY.G.; WangM.M.; SunX.; CongJ.; DengY.; LuH.; YuanT.; Van NostrandJ.D.; LiD.Q.; et al. Soil organic matter quantity and quality shape microbial community compositions of subtropical broadleaved forests. Mol. Ecol. 2015245175–5185. [Google Scholar] [CrossRef] [PubMed]
  95. PehK.S.H.; BalmfordA.; BradburyR.B.; BrownC.; ButchartS.H.M.; HughesF.M.R.; StattersfieldA.; ThomasD.H.L.; WalpoleM.; BaylissJ.; et al. TESSA: A toolkit for rapid assessment of ecosystem services at sites of biodiversity conservation importance. Ecosyst. Serv. 20135E51–E57. [Google Scholar] [CrossRef] [Green Version]
Figure 1. Locations of the study site (a) and experimental design for plant and soil sampling (b) in the Songnen grasslandChina. Three single plant species patchesi.e.Carex duriuscula C.A.Mey. (CD)Lespedeza hedysaroides (Pall.) Kitag. (LH)and Calamagrostis rigidula A.I.Baranov and Skvortsov (CR) assemblages and three multiple species coexisting plant assemblages with different dominant Lespedeza daurica (Laxm.) Schindl. (LD.ass)Leymus chinensis (Trin.) Tzvelev (LC.ass)and Hierochloe glabra Trin. (HG.ass) naturally existing in the grassland. For the six study sites selected abovethe interval between every two sites was greater than 100 m. For plant and soil samplingfive plots (1 m × 1 m) with an interval of more than 10 m were randomly selected at each study site. Five soil cores were randomly selected in each plot by a soil auger.
Biology 11 00870 g001
Figure 2. The ratio of BGB to AGB (a)microbial C limitation (b)and soil multifunctionality (c) in response to plant diversity. ** p < 0.01 and *** p < 0.001 (t-test). AGB: above-ground biomassBGB: below-ground biomass.
Biology 11 00870 g002
Figure 3. Relative abundance of bacterial (a) and fungal (b) dominant genera in different plant diversity levels“Others” represents all genera with relative abundance < 1%.
Biology 11 00870 g003
Figure 4. Relationships between soil microbial carbon (C) limitation and bacterial richness (a) and fungal richness (b). The black lines represent the fitted ordinary least squares (OLS) linear regressions. Red circles represent high plant diversitywhile blue ones indicate low plant diversity.
Biology 11 00870 g004
Figure 5. Relationships between soil multifunctionality and bacterial richness (a)fungal richness (b)pathogens relative abundance (c)saprotrophs relative abundance (d)and symbionts relative abundance (e). The black lines represent the fitted ordinary least squares (OLS) linear regressions. Red circles represent high plant diversitywhile blue ones indicate low plant diversity.
Biology 11 00870 g005
Figure 6. Effects of bacterial (a) and fungal (b) richness on the number of functions above thresholds. Lines represent the slope between soil microbial richness and the number of functions greater than or equal to a threshold value ranging from 5% to 99% of the maximum for each function. The dotted curves indicate the changes in the number of functions per unit increment of the richness of bacteria (c) and fungi (d). Tmin is the minimum threshold that soil multifunctionality becomes influenced by changes in microbial richnessand Rmed is the realized maximum effect of richness on soil multifunctionality.
Biology 11 00870 g006
Figure 7. The percentage of OTUs and relative abundance of six categories of microbial taxa (a). The random forest regression model indicates the main microbial drivers of soil multifunctionality (b). MSE is the mean square error. This accuracy importance measure is computed for each tree and averaged over the forest (5000 trees) and determined by the increase in the MSE. * p < 0.05 on the bar shows that the associated microbial taxa have a significant effect on soil multifunctionality. ART: always rare taxa; CRT: conditionally rare taxa; AAT: always abundant taxa; CAT: conditionally abundant taxa; CRAT: conditionally rare and abundant taxa; MT: moderate taxa.
Biology 11 00870 g007
Figure 8. The piecewise structural equation model was used to test the direct and indirect relationships between plant diversity and soil multifunctionality (a). The corresponding values of the solid line arrows are the width of normalized path system arrows that reflect the size of the normalized path coefficient. The blue and red arrows show significant positive and negative correlationsrespectively (* p < 0.05** p < 0.01and *** p < 0.001). Dashed lines show non-significant relationships. The values above each variable represent the explanatory degree (R2) of each variable in the model. Standardized total effects (direct plus indirect effects) derived from the piecewise structural equation model (b).
Biology 11 00870 g008
Figure 9. A conceptual framework for understanding the effects of plant and fungal richness on soil multifunctionality in a semi-arid grassland. Changing plant biomass allocation patterns increased the ratio of plant below-ground biomass to above-ground biomass under high diversity plant assemblageswhich can alleviate microbial carbon (C) limitation and thus enhance the fungal richnessfinally promoting soil multifunctionality. The fungal richness was positively related to soil multifunctionalitybut the bacterial richness was not. Saprotrophic fungi and rare fungal taxa were essential for maintaining the soil functions. The blue arrow represents an increaseand the red arrow represents a decrease. + and − describe promotion and inhibition effects. AGB: plant above-ground biomass; BGB: plant below-ground biomass; SMF: soil multifunctionality.
Biology 11 00870 g009
Publisher’s Note: MDPI stays neutral with regard to jurisdictional claims in published maps and institutional affiliations.

