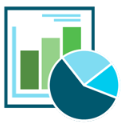
Reporting Dashboards gives organizations immediate visibility into system and business health. Users can create and share dashboards—highlighting business data most important to them—without the need to engage IT resources. Dashboards present data in a variety of graphical formats including chartsgraphsscorecardsgaugesmaps and more. Interactive features then allow users to easily monitor performance and analyze trends in real-time. Dashboards can be accessed from the Unity and Web Clientsin addition to standard web browsersincluding mobile browsersproviding greater accessibility. Quickly view and interpret relevant data and make proactive business decisions with Reporting Dashboards.